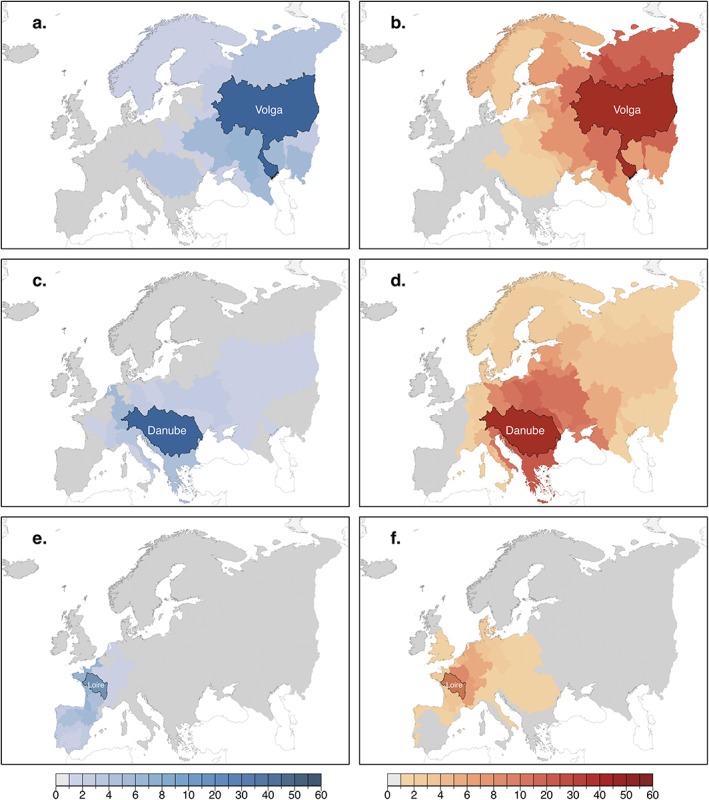
Figure 3.

Watersheds supplying (blue) and receiving (orange) moisture for precipitation to and from (a, b) the Volga, (c, d) Danube, and (e, f) Loire. Colors indicate the ensemble mean PRR [%] and ELPR [%] contributions from and to the source and sink watersheds, respectively. Contributions below 1% are masked in grey. Results correspond to summertime (1980–2016).
