
Figure 4.
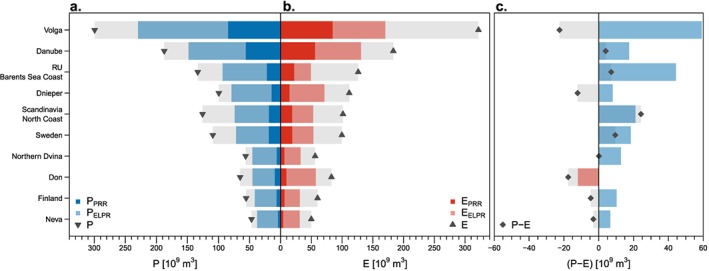
The 10 key watersheds in the watershed precipitation recycling network, ranked according to the average summer precipitation [km3] received from other watersheds. Observations of (a) precipitation, (b) evaporation, and (c) net freshwater availability (E – P < 0) are subdivided into their origin and destination: dark blue (red) colors indicate the total water received (supplied) through terrestrial precipitation recycling from the watershed itself (PRR), and light blue (red) colors indicate the total water received (supplied) from other European watersheds (ELPR). Grey bars and symbols indicate the total evaporation (GLEAM), precipitation (MSWEP), and their difference (P – E), respectively. Values represent the ensemble mean.