
Figure 5.
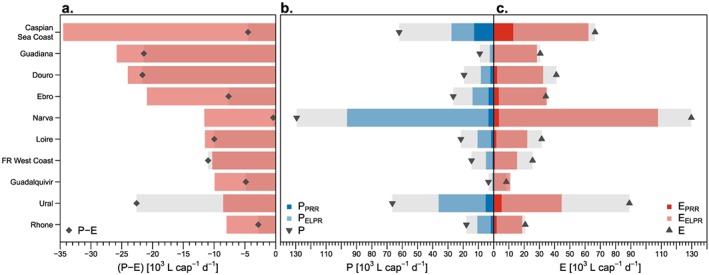
Top 10 watersheds experiencing a net loss of freshwater in liters per capita per day during summer due to precipitation recycling within Europe. Observation‐driven estimates of (a) the net freshwater loss (P < 0), (b) precipitation, and (c) evaporation are subdivided into their origin and destination: dark blue (red) colors indicate the total water received (supplied) through terrestrial precipitation recycling within the watershed itself (PRR), light blue (red) colors indicate the total water received (supplied) from (to) other European watersheds (ELPR). Grey bars and symbols indicate the total evaporation (GLEAM), precipitation (MSWEP), and their difference (P – E), respectively, and thus include extra‐European sinks and sources.