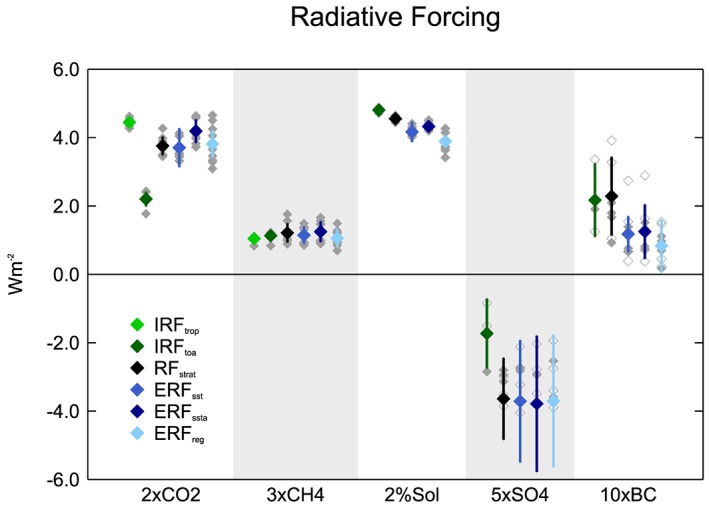
Figure 1.

IRF trop, IRF toa, RF strat, ERF reg, ERF sst, and ERF ssta for the five core PDRMIP forcings. Colored diamonds denote the multimodel mean, and error bars show the intermodel standard deviation. Individual model results are represented by gray diamonds. Hollow gray diamonds denote models which perturbed emissions rather than concentrations in the aerosol experiments. One model (HadGEM3) is off the bottom of the scale for 5×SO4.
