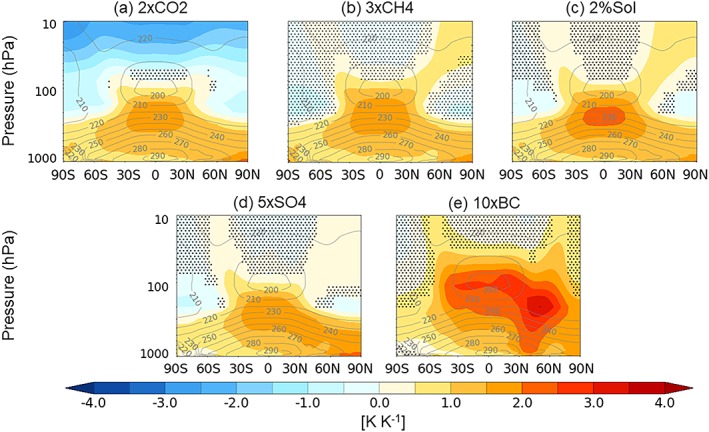
Figure 7.

PDRMIP multimodel zonal mean temperature response to forcing normalized by GSAT change. The gray contours show the multimodel mean zonal temperature climatology. The stippling shows where the MMM difference is less than ±1 standard deviation of the intermodel spread.
