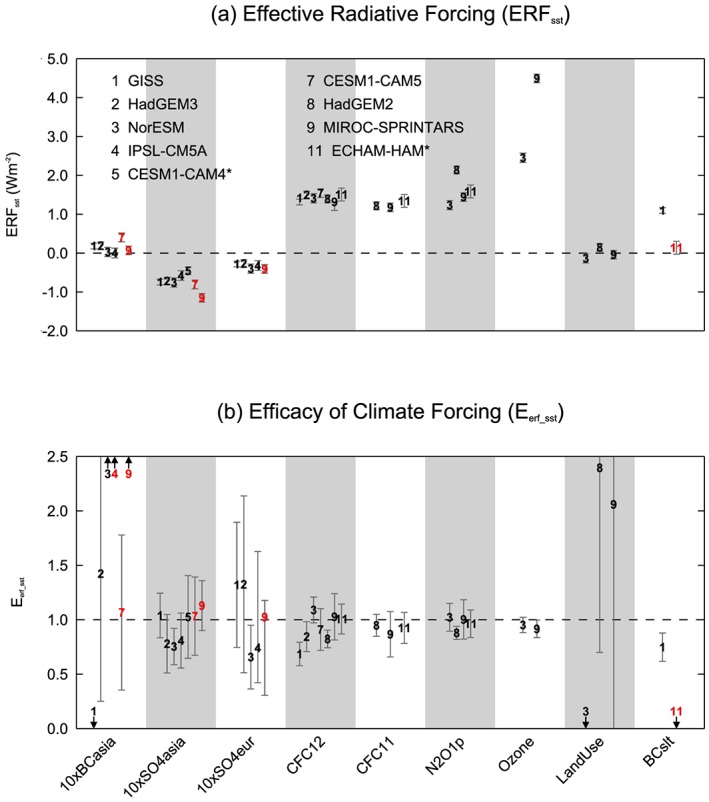
Figure 8.

ERF sst (top) and E erf_sst (bottom) of each model for global and regional forcing experiments performed by a subset of PDRMIP models. The error bars denote the 5–95% confidence interval based on the interannual variability of the control run. Models which perturbed emissions rather than concentrations in the aerosol experiments are shown in red. CESM1‐CAM4 and ECHAM‐HAM are run with a slab ocean.
