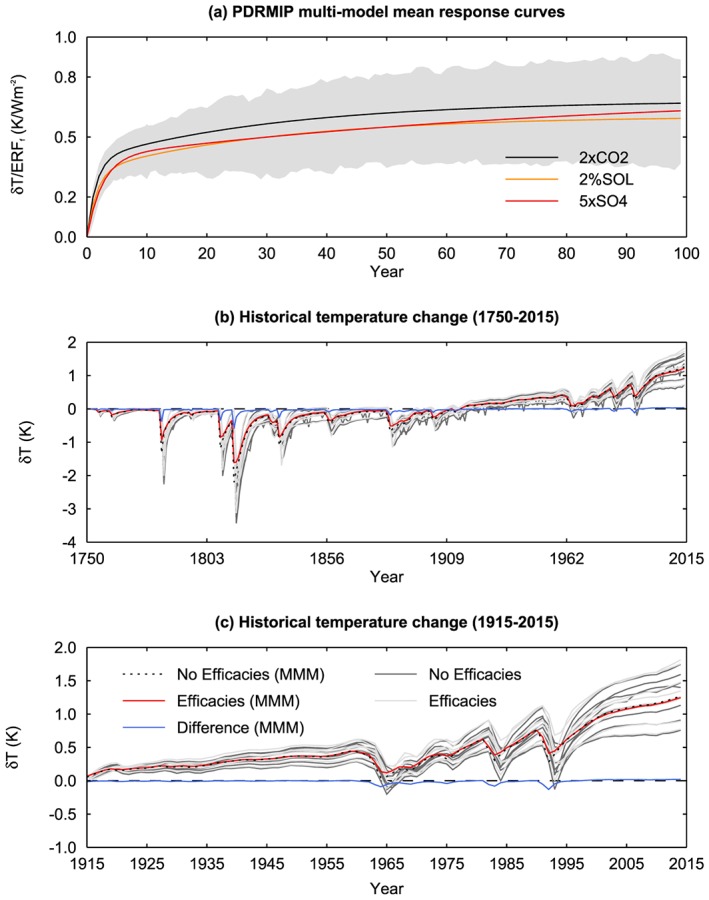
Figure 10.

Panel (a) shows the multimodel mean GSAT response curves as a function of time for 2×CO2, 5×SO4, and 2%SOL normalized by ERF sst. The intermodel standard deviation is shown in gray. Panel (b) shows the multimodel mean historical GSAT change computed using the impulse response model described in section 2.5 not accounting for efficacies (red) and accounting for efficacies (black dotted). The difference is shown in blue. Individual model results not accounting for efficacies are shown by dark gray lines GSAT and accounting for efficacies by light gray lines. Panel (c) shows the same as panel (b) for the period 1915–2014 and therefore includes no extrapolation of the response curves beyond the 100 years of PDRMIP data.
