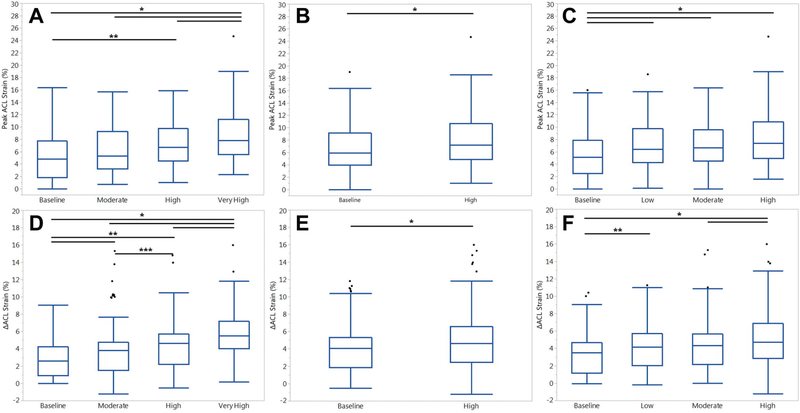
Figure 3.
Box plots with medians and interquartile ranges for peak ACL strain from all trials, separated by risk level for each loading factor: (A) KAM, (B) ATS, and (C) ITR. Means and SDs for △ACL strain from all trials, separated by risk level for each loading factor: (D) KAM, (E) ATS, and (F) ITR. Horizontal bars at the superior aspect of the graph indicate significant difference (P < .05) between the 2 indicated risk levels. Error bars indicate 95% CI, and circles indicate outliers. *P < .05. **P < .01. ***P < .001. ACL, anterior cruciate ligament; ATS, anterior tibial shear; ITR, internal tibial rotation; KAM, knee abduction moment.

