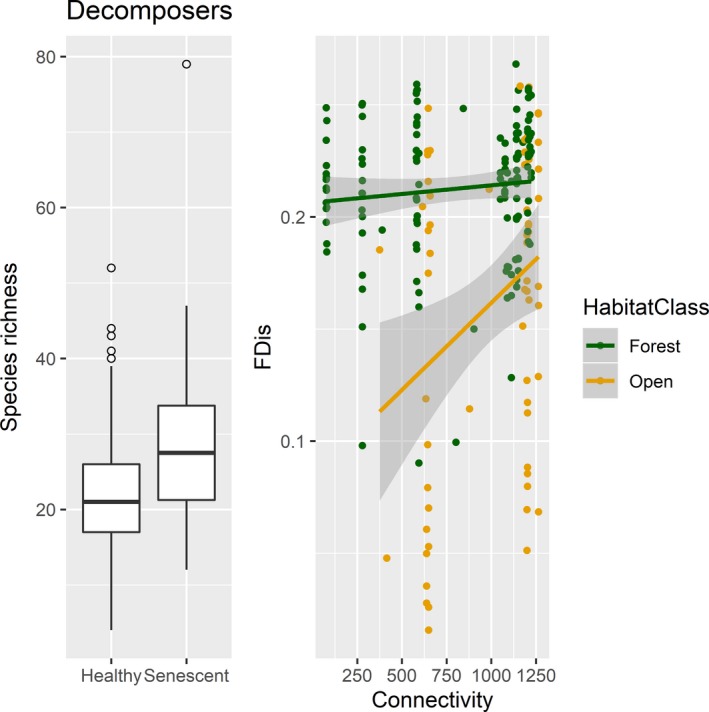
Figure 6.

Left plot: Boxplot of species richness and health of the tree. Decomposer species richness was significantly higher in traps mounted on senescent trees than healthy ones. The plot shows the median, first, and third quartiles, with whisker that extend 1.5 times the interquartile range, and observations beyond the end of the whiskers as points. Right plot: Decomposer functional diversity (FDis, y‐axis) was significantly higher in traps mounted on trees in forests (green) than in open landscapes (yellow), and connectivity (x‐axis, measured as the number of predicted veteran oaks within a 5 km radius of the focal tree) had a significate positive effect in open landscapes but no effect in forests. Regression lines are the results from a linear mixed model that predicted FDis with year and tree as random effects, and the gray area around the lines is the 95% confidence interval. Values in the figure have been back transformed, but for the analysis all continuous predictor variables were scaled by subtracting the mean and dividing by the standard deviation of the data matrix
