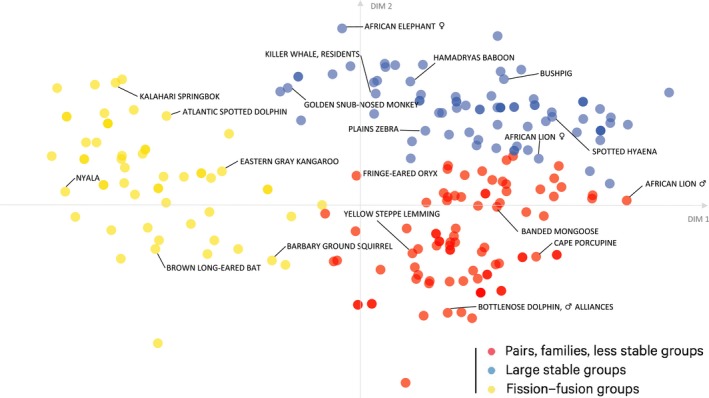
Figure 2.

Distribution of society components across cluster landscape. After performing a PCA, the resulting coordinates of 220 society components across 208 species for each of the eight variables were reduced to two dimensions. Circles are colored according to the clusters they were assigned to by the FGMM. Society components within the yellow cluster are characterized by “individual” as primary unit, fluid stability, and mostly open tolerance. Society components within the blue cluster are mostly larger groups and families with long‐lasting to philopatric offspring membership and long‐lasting to permanent stability. The red cluster consists of society components that mostly live in pairs or families with offspring that are generally not philopatric (except for few exceptions). Society components in the red cluster tend to be more tolerant than those in the blue cluster. The results from the genus‐level analysis are given in Figure A3
