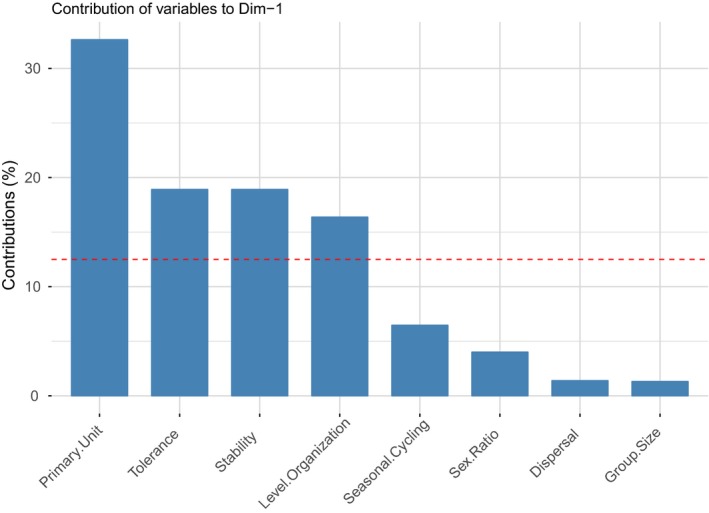
Figure A1.

Contribution of variables to first principal component. The percentage to which each variable contributes to the first component after performing the PCA on the scores of the society components. The red dashed line indicates the expected average contribution. Contributions of first variables: primary unit: 32.55%; tolerance: 18.63%, stability: 18.61%; level organization: 6.53%
