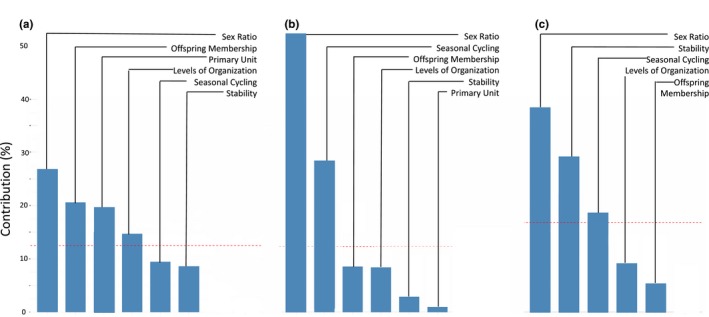
Figure A2.

Contribution of the eight dimensions to first principal component within the three main clusters. The percentage is the contribution of data from that dimension that contributes to the first component after performing the PCA on the scores of the society components and then performing it a second time on the resulting clusters assigned by the FGMM. The red dashed line indicates the expected average contribution. (a) contribution of dimensions to first PC within cluster 1 (pairs, families, and less stable groups); (b) contribution of dimensions to first PC within cluster 2 (large stable groups); (c) contribution of dimensions to first PC within cluster 3 (groups with high degree of fission–fusion)
