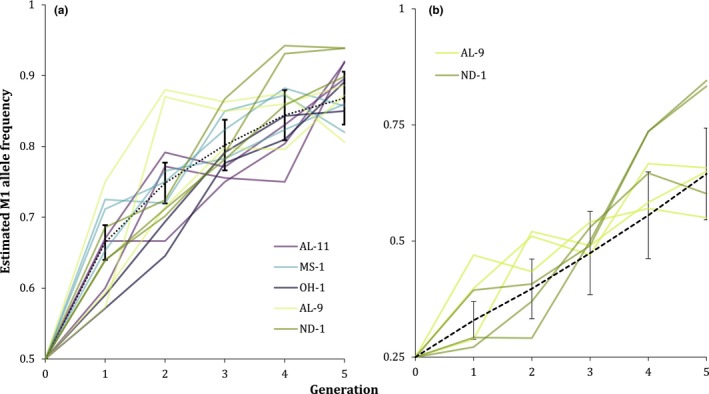
Figure 4.

M1 frequency increases in both previously fixed and previously non‐M1 populations. (a) Previously fixed “susceptible” (yellow/green) and previously non‐M1 “resistant” (blue/purple) 0.5 initial‐frequency replicates compared to model expectations with a heterozygote fitness cost of 0.3. (b) Previously non‐M1 0.25 initial‐frequency replicates compared to model expectations with no fitness cost
