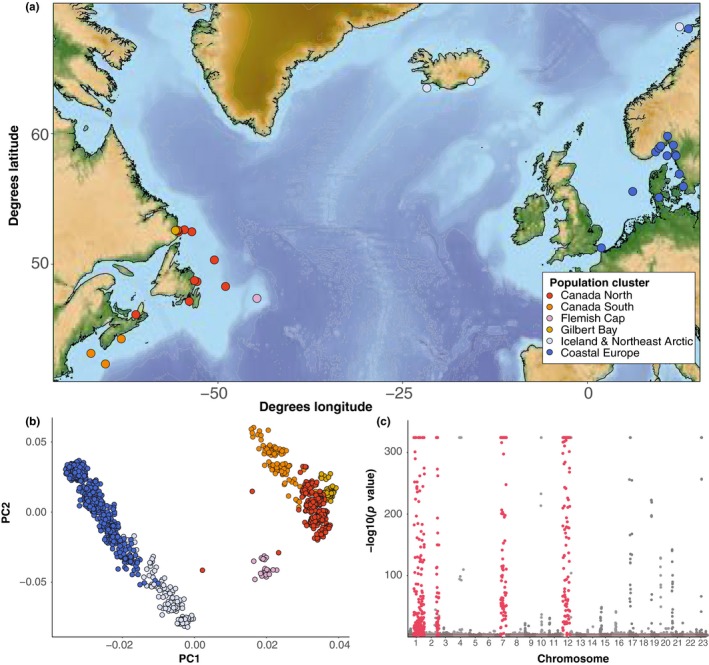
Figure 1.

Geographic location of sampling sites, population clusters, and single nucleotide polymorphism (SNP) correlations with principal component axes associated with population structure in Atlantic cod. (a) Location and population clusters of sampling sites. (b) Population clustering of samples on the first two principal component axes in pcadapt. (c) Significance of correlation of each SNP (p value) with the K = 25 retained principal components in pcadapt. Chromosome rearrangements are marked in red
