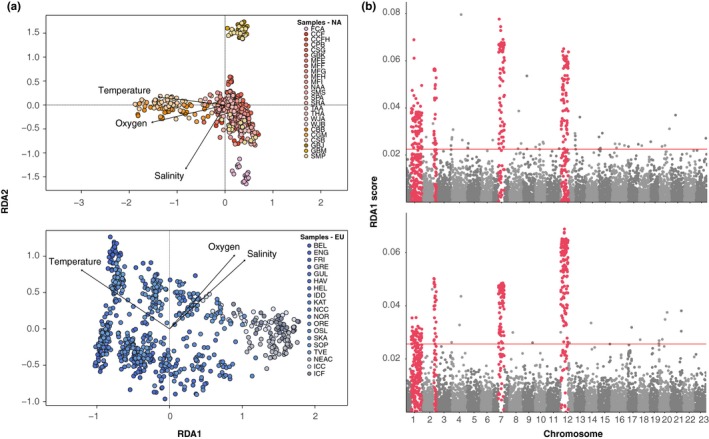
Figure 5.

Redundancy analysis of single nucleotide polymorphisms (SNPs) with temperature, salinity, and oxygen in North America and Europe. (a) Biplots of RDA1 and RDA2 scores for each individual color coded by population with vectors describing variation due to oxygen, temperature, and salinity gradients in North America and Europe. (b) Absolute values of scores for each SNP on RDA1 within North America and Europe. Significant SNPs are those with scores greater than the 95th percentile. Chromosome rearrangements are marked in red
