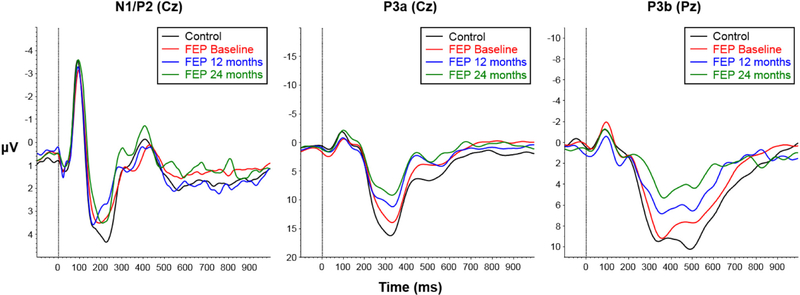
Fig. 1.
Grand average waveforms for control subjects (black) and first episode psychosis (FEP) patients at baseline (red), 12 months (blue), and 24 months (green). Left: N1 and P2 recorded at Cz in response to standard stimuli. Middle: P3a recorded at Cz in response to infrequent novel stimuli. Right: P3b recorded at Pz in response to infrequent target stimuli. Dotted vertical line at 0 ms marks stimulus presentation. (For interpretation of the references to colour in this figure legend, the reader is referred to the web version of this article.)

