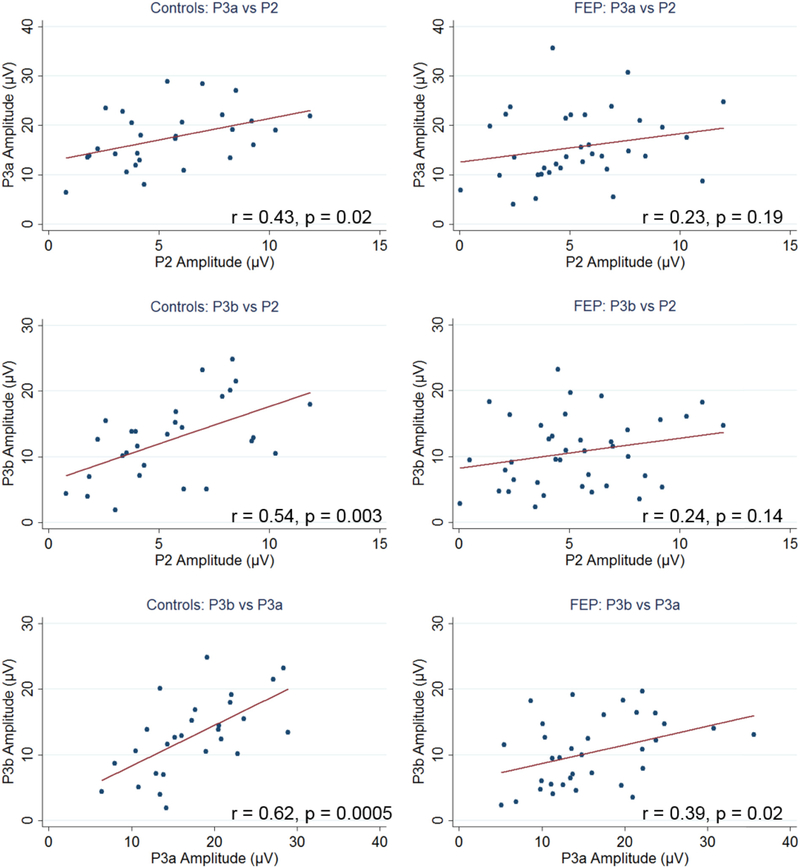
Fig. 4.
Correlations between P2, P3a, and P3b amplitudes for control subjects (left) and first episode psychosis (FEP) patients (right).
Note: blue dots represent individual subjects and red lines mark the best linear fit. (For interpretation of the references to colour in this figure legend, the reader is referred to the web version of this article.)

