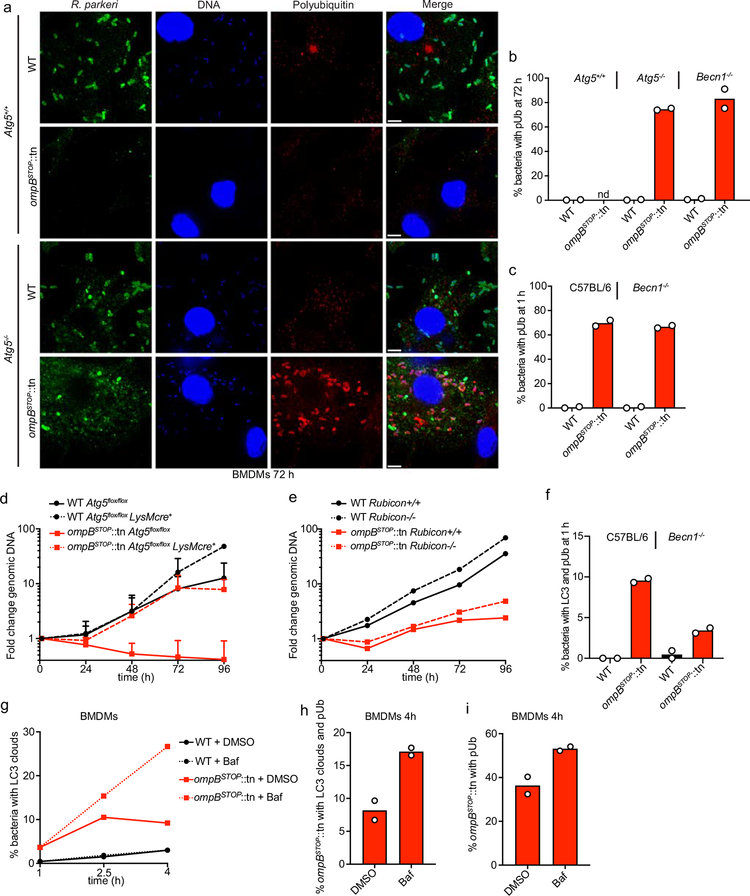
Extended Data Fig. 8. Autophagy is the primary mechanism that restricts the growth of ompB mutant bacteria in macrophages, and OmpB protects R. parkeri from ubiquitylation in autophagy-deficient cells.
(a) Immunofluorescence micrographs of Atg5+/+ or Atg5−/− BMDMs infected with WT or ompBSTOP::tn bacteria at 72 hpi, stained for bacteria (green), cellular and bacterial genomic DNA (blue; Hoechst), polyubiquitin (red; FK1 antibody). Scale bars, 5 μm. (b) Quantification of the percentage of bacteria that co-localize with polyubiquitin in Atg5+/+, Atg5−/−, or Becn1−/− BMDMs at 72 hpi (nd indicates that too few ompBSTOP::tn bacteria were visualized in Atg5+/+ cells to quantify a percentage). Data are mean (n = 2; ≥250 bacteria were counted for each strain and infection). (c) Quantification of the percentage of bacteria that co-localize with polyubiquitin in C57BL/6 or Becn1−/− BMDMs at 1 hpi. Data are mean (n = 2; ≥84 bacteria were counted for each strain and infection). (d) Combined growth curves of WT and ompBSTOP::tn in Atg5+/+ or Atg5−/− BMDMs as measured by genomic equivalents using qPCR. Data are the same as that shown in Fig. 6a and b and are mean ± SEM (n = 4). (e) Growth curves of WT and ompBSTOP::tn in Rubicon−/− or Rubicon+/+ BMDMs as measured in (d). Data are mean (n = 2). (f) Quantification of the percentage LC3 and polyubiquitin-positive bacteria in C57BL/6 or Becn1−/− BMDMs at 1 hpi. Data are mean (n = 2; ≥84 bacteria were counted for each strain and infection). (g) Quantification of the percentage LC3-positive bacteria at 1, 2.5 and 4 hpi in BMDMs treated with 300 nM bafilomycin A (Baf) or corresponding amount of DMSO, starting at 1 hpi. Data are means (n = 2; ≥111 ompBSTOP::tn bacteria were counted per infection, experiment and time-point). (h,i) Quantification of the percentage (h) LC3-positive ompBSTOP::tn that also co-localize with polyubiquitin at 4 hpi, and (i) polyubiquitin-positive ompBSTOP::tn, after bafilomycin A treatment as in (g). Data are mean (n = 2; ≥119 ompBSTOP::tn bacteria were counted per infection and experiment).

