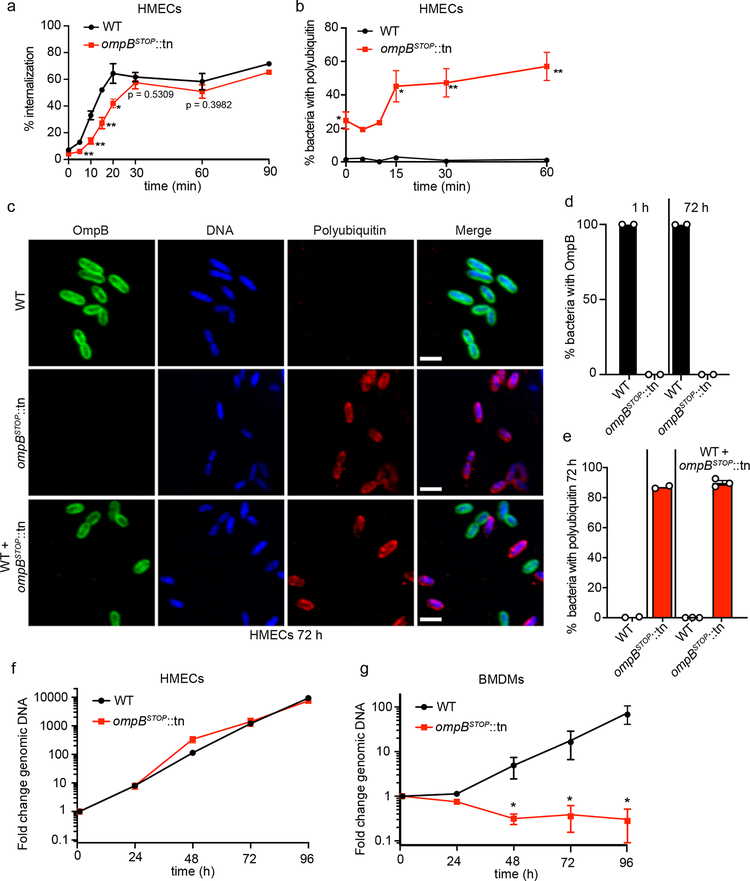
Fig. 2. OmpB acts locally on R. parkeri to promote polyubiquitin avoidance, and OmpB is required for bacterial growth in BMDMs but not in HMECs.
(a) Quantification of the percentage of invasion of HMECs from 0–90 mpi, visualized by differential staining of extracellular versus total R. parkeri. Data are mean ± SEM (0, 20, 30, 60 min, n = 3; 5, 10, 15 min, n = 4; 90 min, n = 2; ≥85 bacteria were counted for each strain, infection and time-point; statistical comparisons between ompBSTOP::tn and WT for each time point were made by the unpaired Student’s t-test (two-sided); *, p < 0.05; **, p < 0.01). (b) Quantification of the percentage of WT and ompBSTOP::tn mutant bacteria that co-localize with polyubiquitin from 0–60 mpi. Data are mean ± SEM (0, 15, 30, 60 min, n = 3; 5, 10 min, n = 2; statistical comparisons between ompBSTOP::tn and WT were made by the unpaired Student’s t-test (two-sided); *, p < 0.05; **, p < 0.01; ≥85 bacteria were counted for each strain, infection and time point. (c) Immunofluorescence micrographs of HMECs infected with WT (upper panel), ompBSTOP::tn (middle panel), or with both WT and ompBSTOP::tn (lower panel), at 72 hpi stained for OmpB (green, anti-OmpB antibody), polyubiquitin (red; FK1 antibody), and DNA (blue; Hoechst). Scale bars, 2 μm. (d) Quantification of the mean percentage of WT and ompBSTOP::tn mutant bacteria in HMECs that have OmpB homogeneously distributed at the surface of each bacterium at 1 and 72 hpi (n = 2; for 1 hpi, ≥109 bacteria were counted per strain; for 72 hpi, ≥724 bacteria were counted per strain). (e) Quantification of the percentage of WT and ompBSTOP::tn mutant bacteria positive for polyubiquitin in HMECs infected with WT, ompBSTOP::tn, or co-infected with both. In the mixed infected, WT and ompBSTOP::tn bacteria were distinguished using the anti-OmpB antibody. Data are mean ± SEM (singly infected cells, n = 2; mixed infected cells, n = 3; ≥880 bacteria were counted for each infection). (f) Growth curves of WT and ompBSTOP::tn in HMECs from 0–96 hpi as measured by genomic equivalents using qPCR. Data are mean ± SEM (n = 3; means were not significantly different by an unpaired Student’s t-test (two-sided); 24 h, p > 0.99; 48 h, p = 0.10; 72 h, p > 0.99; 96 h, p = 0.40). (g) Growth curves of WT and ompBSTOP::tn in BMDMs from 0–96 hpi as in (f). Data are mean ± SEM (n = 4; statistical comparisons with WT were by the Mann-Whitney rank-sum test (two-sided); *, p < 0.05).

