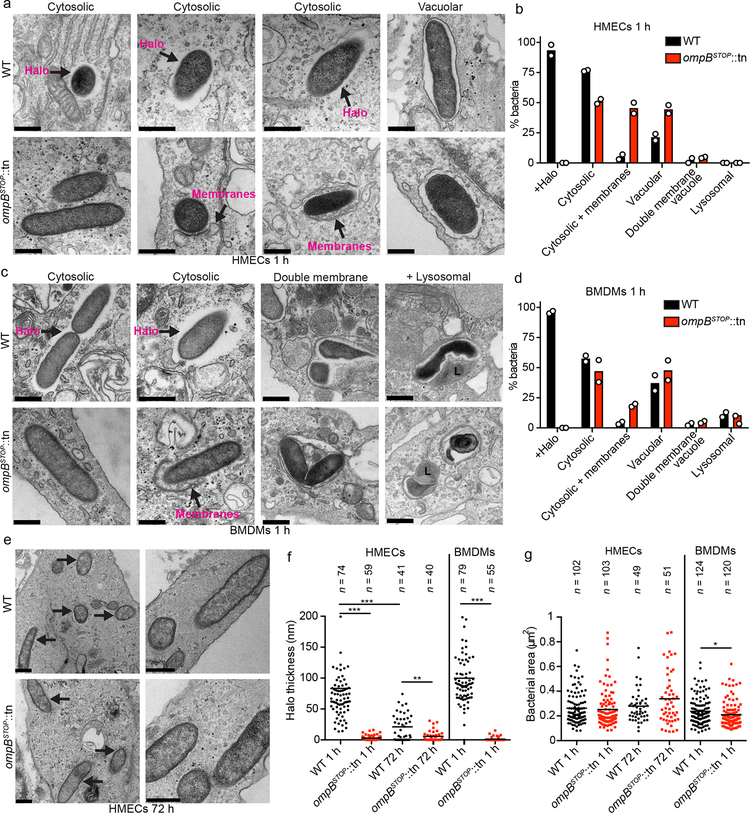
Fig. 3. OmpB is required for the formation of an electron-lucent halo in host cells.
(a and c) TEM images of WT and ompBSTOP::tn mutant bacteria in (a) HMECs or (c) BMDMs at 1 hpi, in the indicated cellular locations. Arrows indicate halos that appear as electron-lucent areas around WT bacteria, and membranes associated with bacteria, as labeled. Scale bars, 500 nm. (b and d) Mean percentage of WT and bacteria ompBSTOP::tn mutant bacteria in (b) HMECs or (d) BMDMs with the indicated characteristics or location: with halo (Halo+), cytosolic, cytosolic associated with (+) membranes (bacteria were associated with double membranes or membrane-bound organelles over part of their surface or at their poles), in a single membrane vacuole(vacuolar), in a double membrane vacuole, or in a lysosome (bacteria surrounded by electron-dense material that often had irregular shapes53) (n = 2; ≥50 bacteria per strain and host cell type were counted in each experiment). (e) TEM images of WT and ompBSTOP::tn bacteria at 72 h in HMEC cells. Arrows indicate bacteria. Scale bars, 500 nm. (f) Quantification of halo thickness in HEMCs at 1 hpi and 72 hpi, and in BMDMs at 1 hpi. All data points are presented, and the lines indicate the means (statistical comparisons were by the Mann-Whitney rank-sum test (two-sided); **, p < 0.01; ***, p < 0.001). (g) Quantification of the bacterial body area (excluding the halo) in HEMCs at 1 hpi and 72 hpi, and in BMDMs at 1 hpi. All data points are presented, and the lines indicate the means of (statistical comparisons were by the Mann-Whitney rank-sum test (two-410sided); *, p < 0.05).

