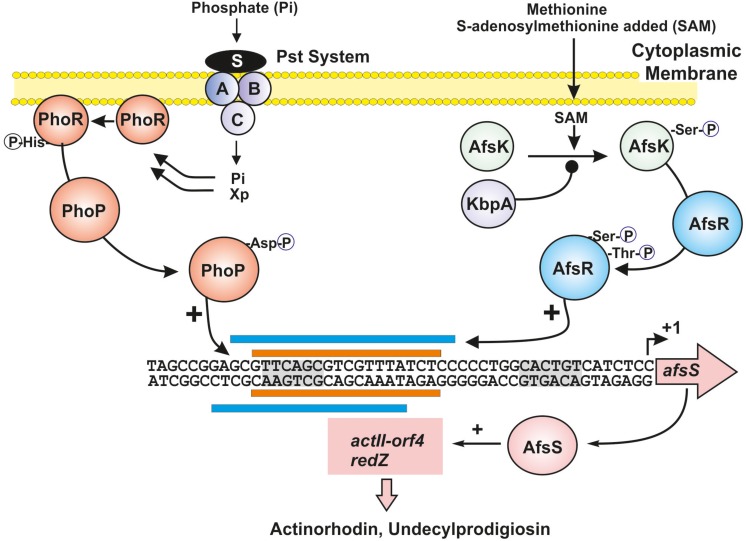
FIGURE 1.
Integration of phosphate limitation and S-adenosylmethionine signals through overlapping transcriptional factors. The TCS regulatory proteins PhoR and PhoP are shown in dark orange. Xp indicates the proposed intracellular signal in B. subtilis. The methionine signal transduction cascade through AfsK (green sphere) and AfsR (blue sphere) is shown at the right site; KbpA (purple sphere) acts as an inhibitor of AfsK phosphorylation. The sites for PhoP and AfsR binding, in the region upstream of the afsS gene, are shown with orange and blue bars, respectively. The -10 and -35 sites (gray shadows) and the transcription start point of the afsS gene are indicated. Positive regulation is indicated by arrows and negative regulations by black spheres. See text for additional details.

