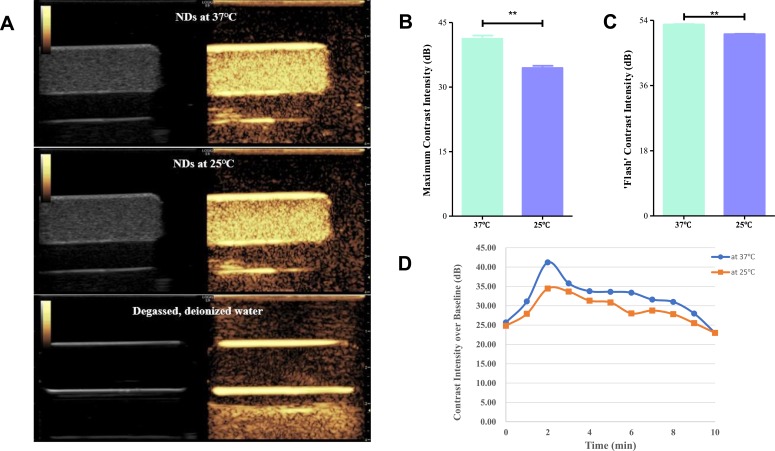
Figure 6.
Capacity as UCAs for contrast enhancement in vitro. (A) The contrast images at the maximum contrast intensities of nanobubbles at 25°C and 37°C, the degassed, deionized water used as negative control. (B) Comparison of the maximum contrast intensities between 25°C and 37°C. **p<0.001. (C) Comparison of the “manual flash” contrast intensities between 25°C and 37°C. **p<0.001. (D) The SR curve of NDs at different time point.

