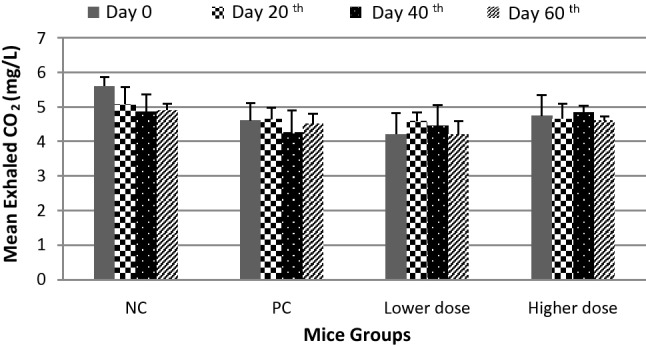
Fig. 3.

Mean exhaled CO2 in mice. Data are presented as mean ± standard deviation (SD). NC, negative control group; PC, positive control group; Lower dose, groups of 0.0001 mg/L prallethrin and 0.104 mg/L d-phenothrin exposures; Higher dose, groups of 0.001 mg/L prallethrin and 1.04 mg/L d-phenothrin exposures
