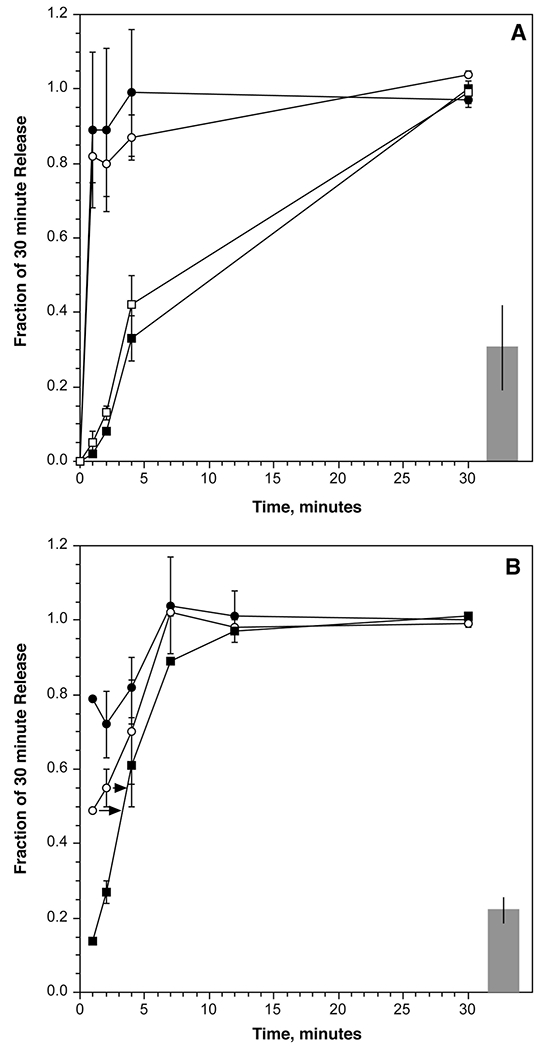
Fig. 3.

Using kinetic dilutions to assess the equilibration rate of an aggregating stimulus. Panel A: leukocytes were sensitized with BPO-specific IgE and stimulated with BPO2 (80 pM). At the time points shown, the reaction mixture was diluted as described in the methods and the reaction allowed to proceed until the 30 minute time before harvesting the supernatant (n=5); (▪) EDTA kinetic, (□) BPO-EACA (0.1 mM) kinetic, (○)dilution kinetic, (●)maintained concentration kinetic. Panel B: similar in design to the experiments in panel A but using 6061P anti-IgE Ab (0.8 μg/ml) to initiate the reaction (n=3); (▪) EDTA kinetic, (○)dilution kinetic, (●) maintained concentration kinetic. For both panels the data is expressed as a fraction of the release measured at the 30 minute time point without dilution. Also shown as the bar at the right of the plot is the release obtained with the concentration of diluted (20-fold) stimulus for the entire 30 minutes (relative to the initiating concentration release at 30 minutes). The initiating concentration, on average, induced 36±5% release for BPO2 and 70±12% release for 6061P. In panel B, the arrows indicate the time interval to that matches the dilution kinetic to the EDTA kinetic.
