
Figure 6:
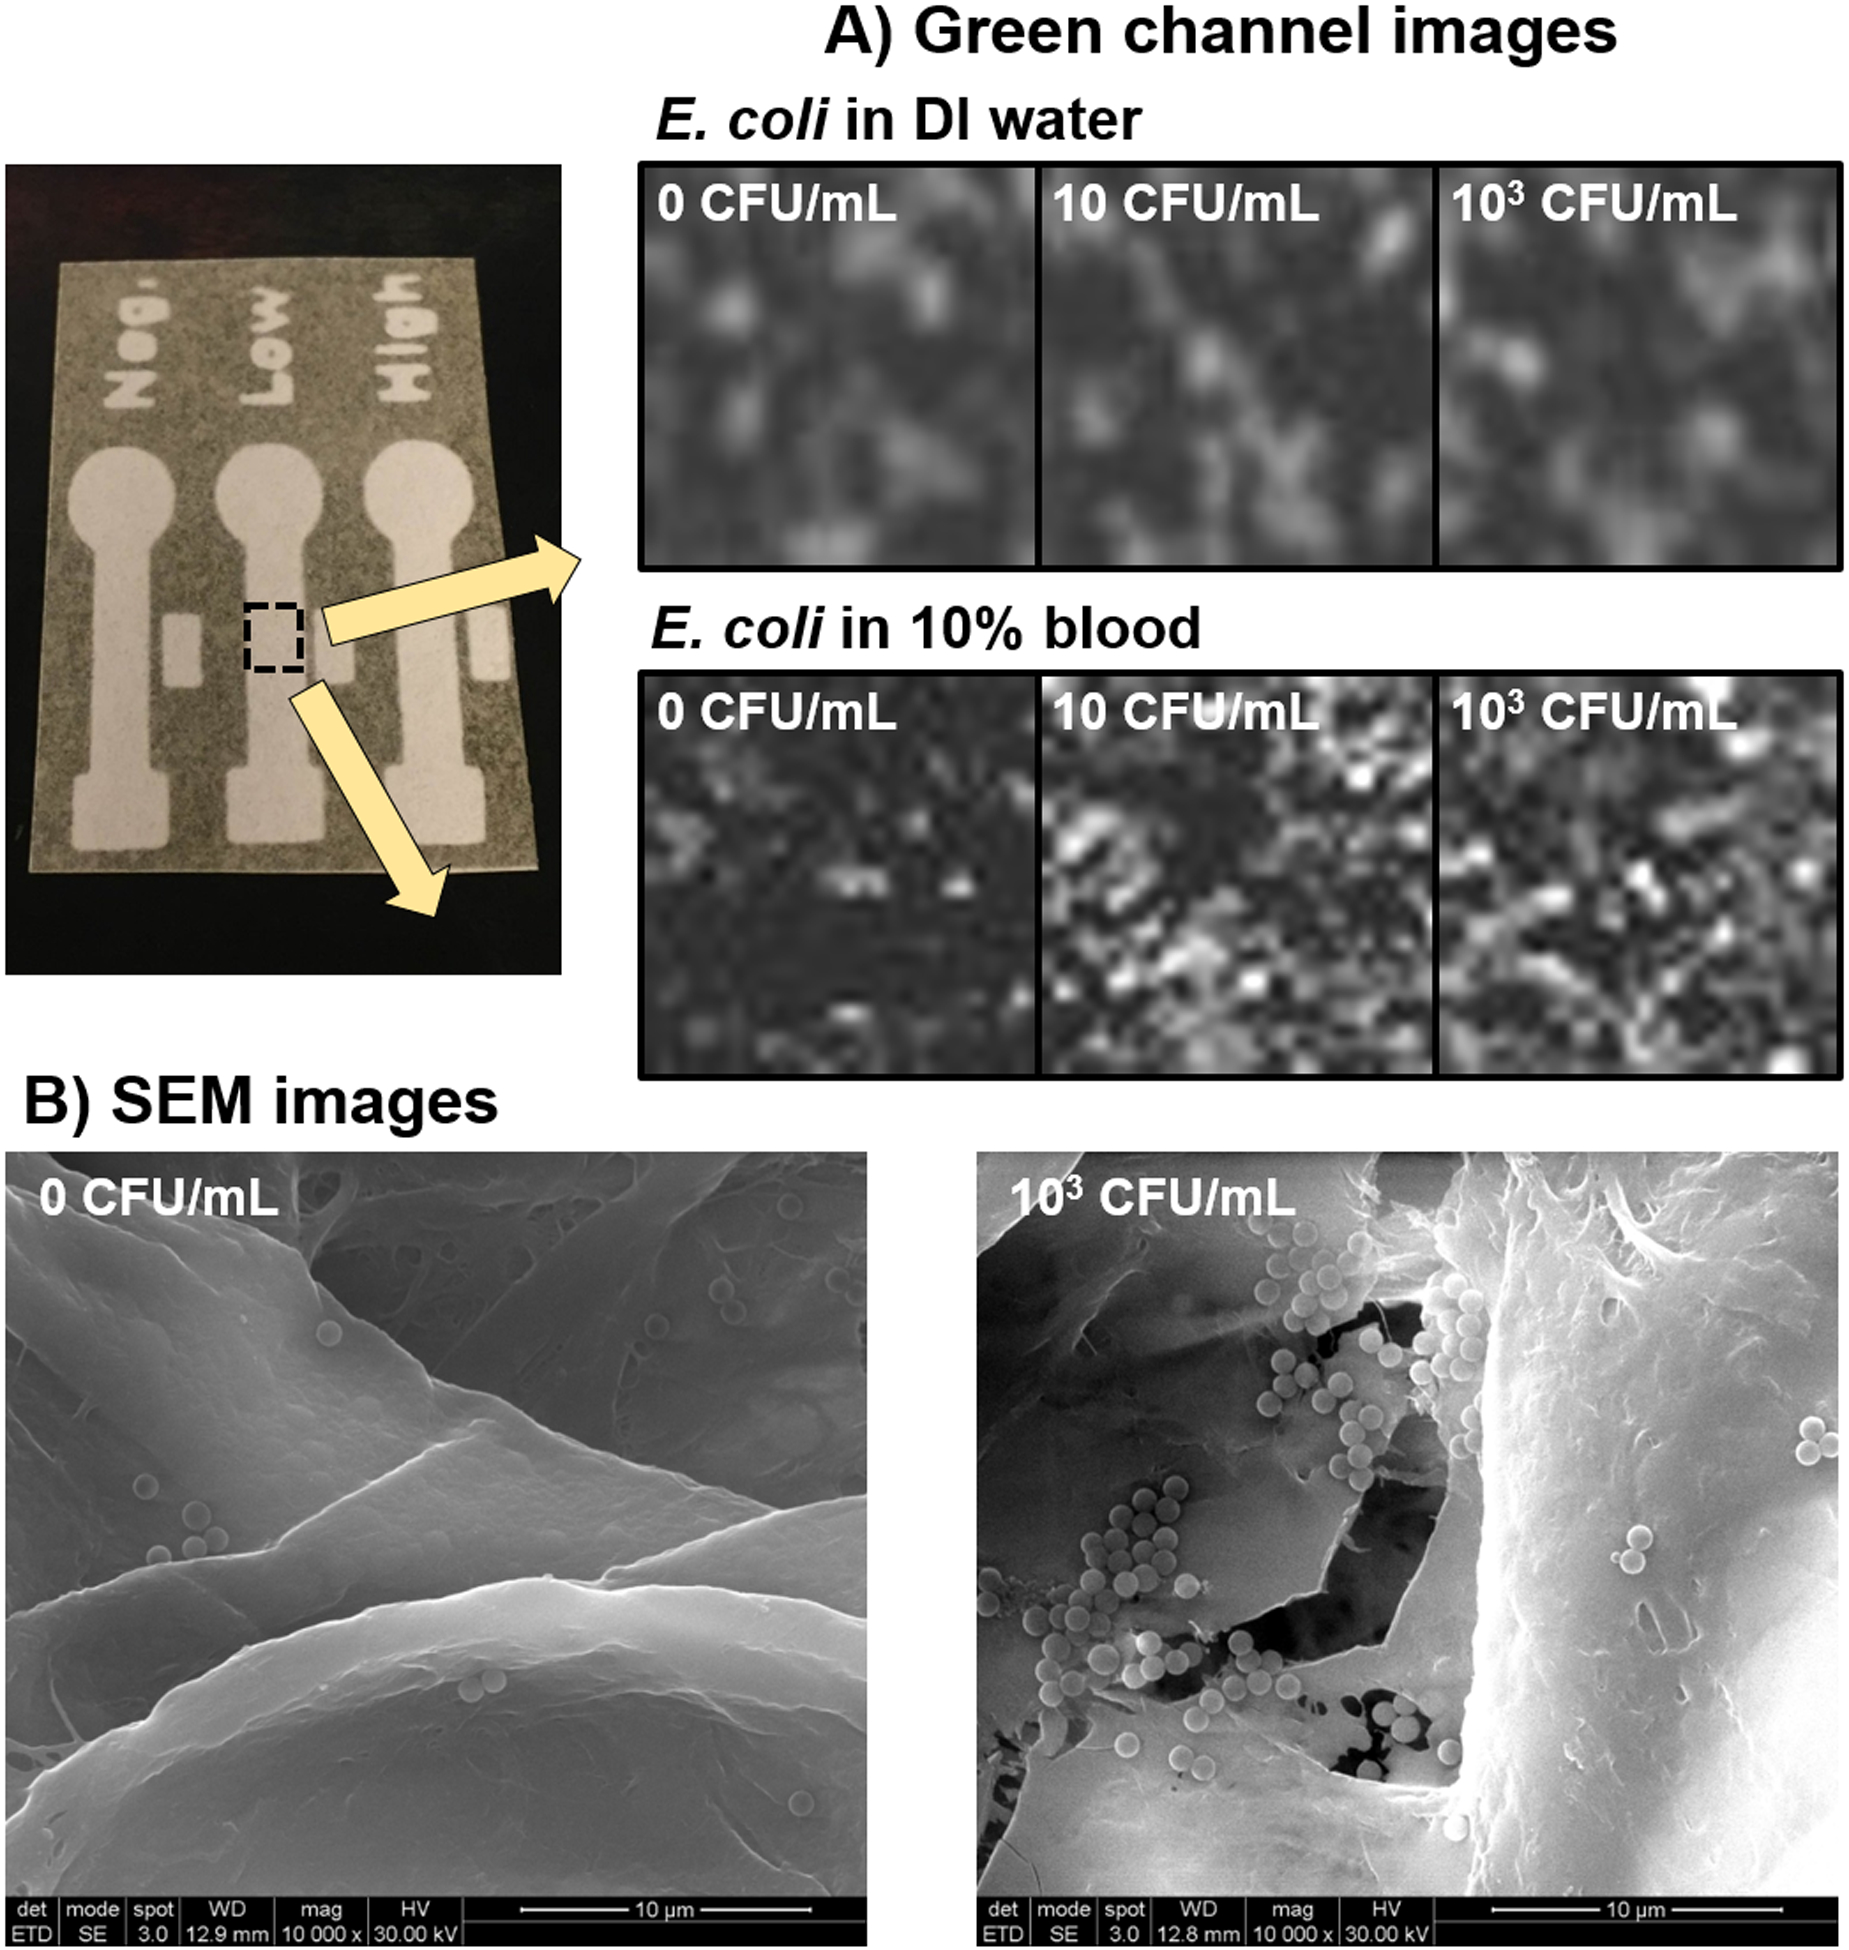
(A) A series of macroscopic, green channel images of the central detection zone of each paper microfluidic channel with 0, 10, and 103 CFU/mL E. coli in DI water or 10% whole blood. (B) SEM images of the central detection zone of each paper microfluidic channel with 0 and 103 CFU/mL E. coli in DI water.