
Extended Data Figure 7 |. Additional analyses of mitochondrial membrane potential conduction.
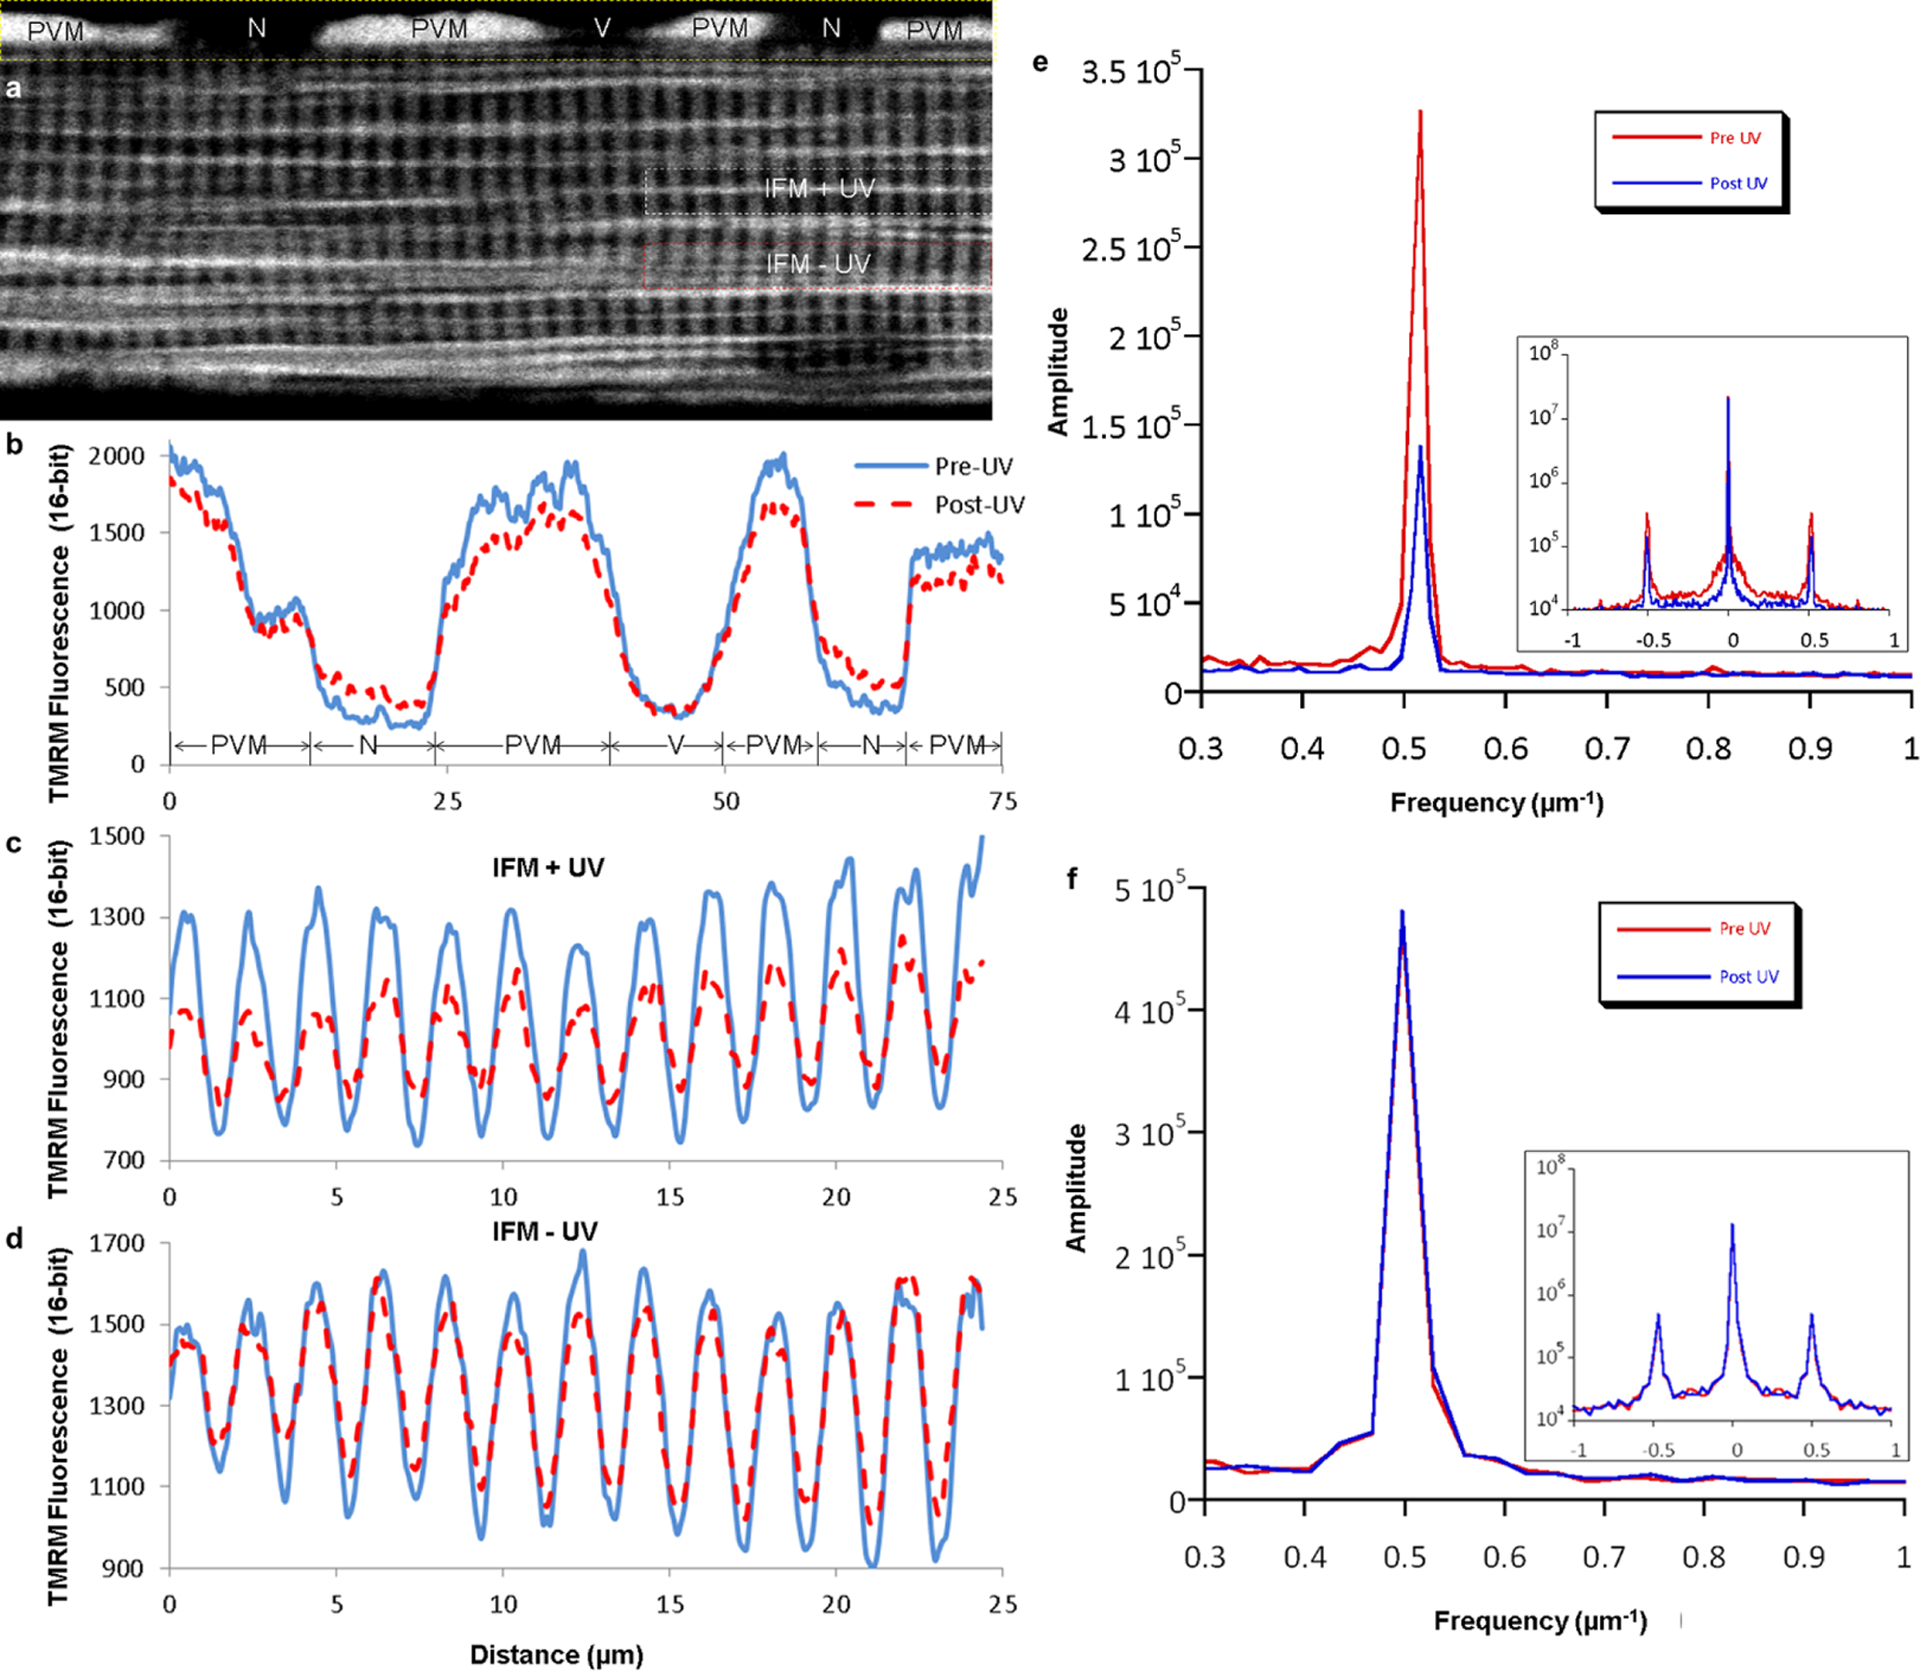
a, Confocal image of an isolated muscle fibre loaded with TMRM showing regions chosen for representative line profile analysis. Images are representative of 11 fibres from 4 mice. b, Line profile of TMRM fluorescence in the PVM+nuclear (N) region of the cell (marked by yellow dotted lines in a) before and after activation of MitoPhotoDNP shows a decrease in PVM signal, increase in N signal, and no change outside of the cell where a blood vessel (V) was located before enzymatic fibre isolation. c, Line profile of TMRM fluorescence in the region of the cell irradiated with UV light (irradiated, marked by white dotted lines in a) showing a decrease in mitochondrial signal (peaks) and an increase in cytosolic signal (troughs) after MitoPhotoDNP activation. d, Line profile of TMRM fluorescence in the non-irradiated IFM region of the cell (intra-fibrillar, marked by red dotted lines in a) showing a decrease in mitochondrial signal (peaks) and an increase in cytosolic signal (troughs) after MitoPhotoDNP activation. c and d take advantage of the regular pattern of IBM and cytosol in the intra-fibrillar space. However, any FPM in the regions selected for analysis may confound these results. A more robust analysis that selects only the IBM is shown in e and f. e, Representative fast Fourier transform (FFT) power spectrum of IFM TMRM signal reveals a 61 ± 3% decrease (n = 9 experiments) in the amplitude of IBM component (0.5 μm−1 frequency) after MitoPhotoDNP activation. Inset: log scale full FFT power spectrum. f, Representative FFT analyses of IFM mitochondria reveals no change (pre/post = 1.0 ± 0.03, n = 5 experiments) in the TMRM amplitude of IBM (0.5 μm−1 frequency) after UV exposure when MitoPhotoDNP is not present. Inset: log scale full FFT power spectrum.