
Figure 3 |. Capacity for membrane potential conduction.
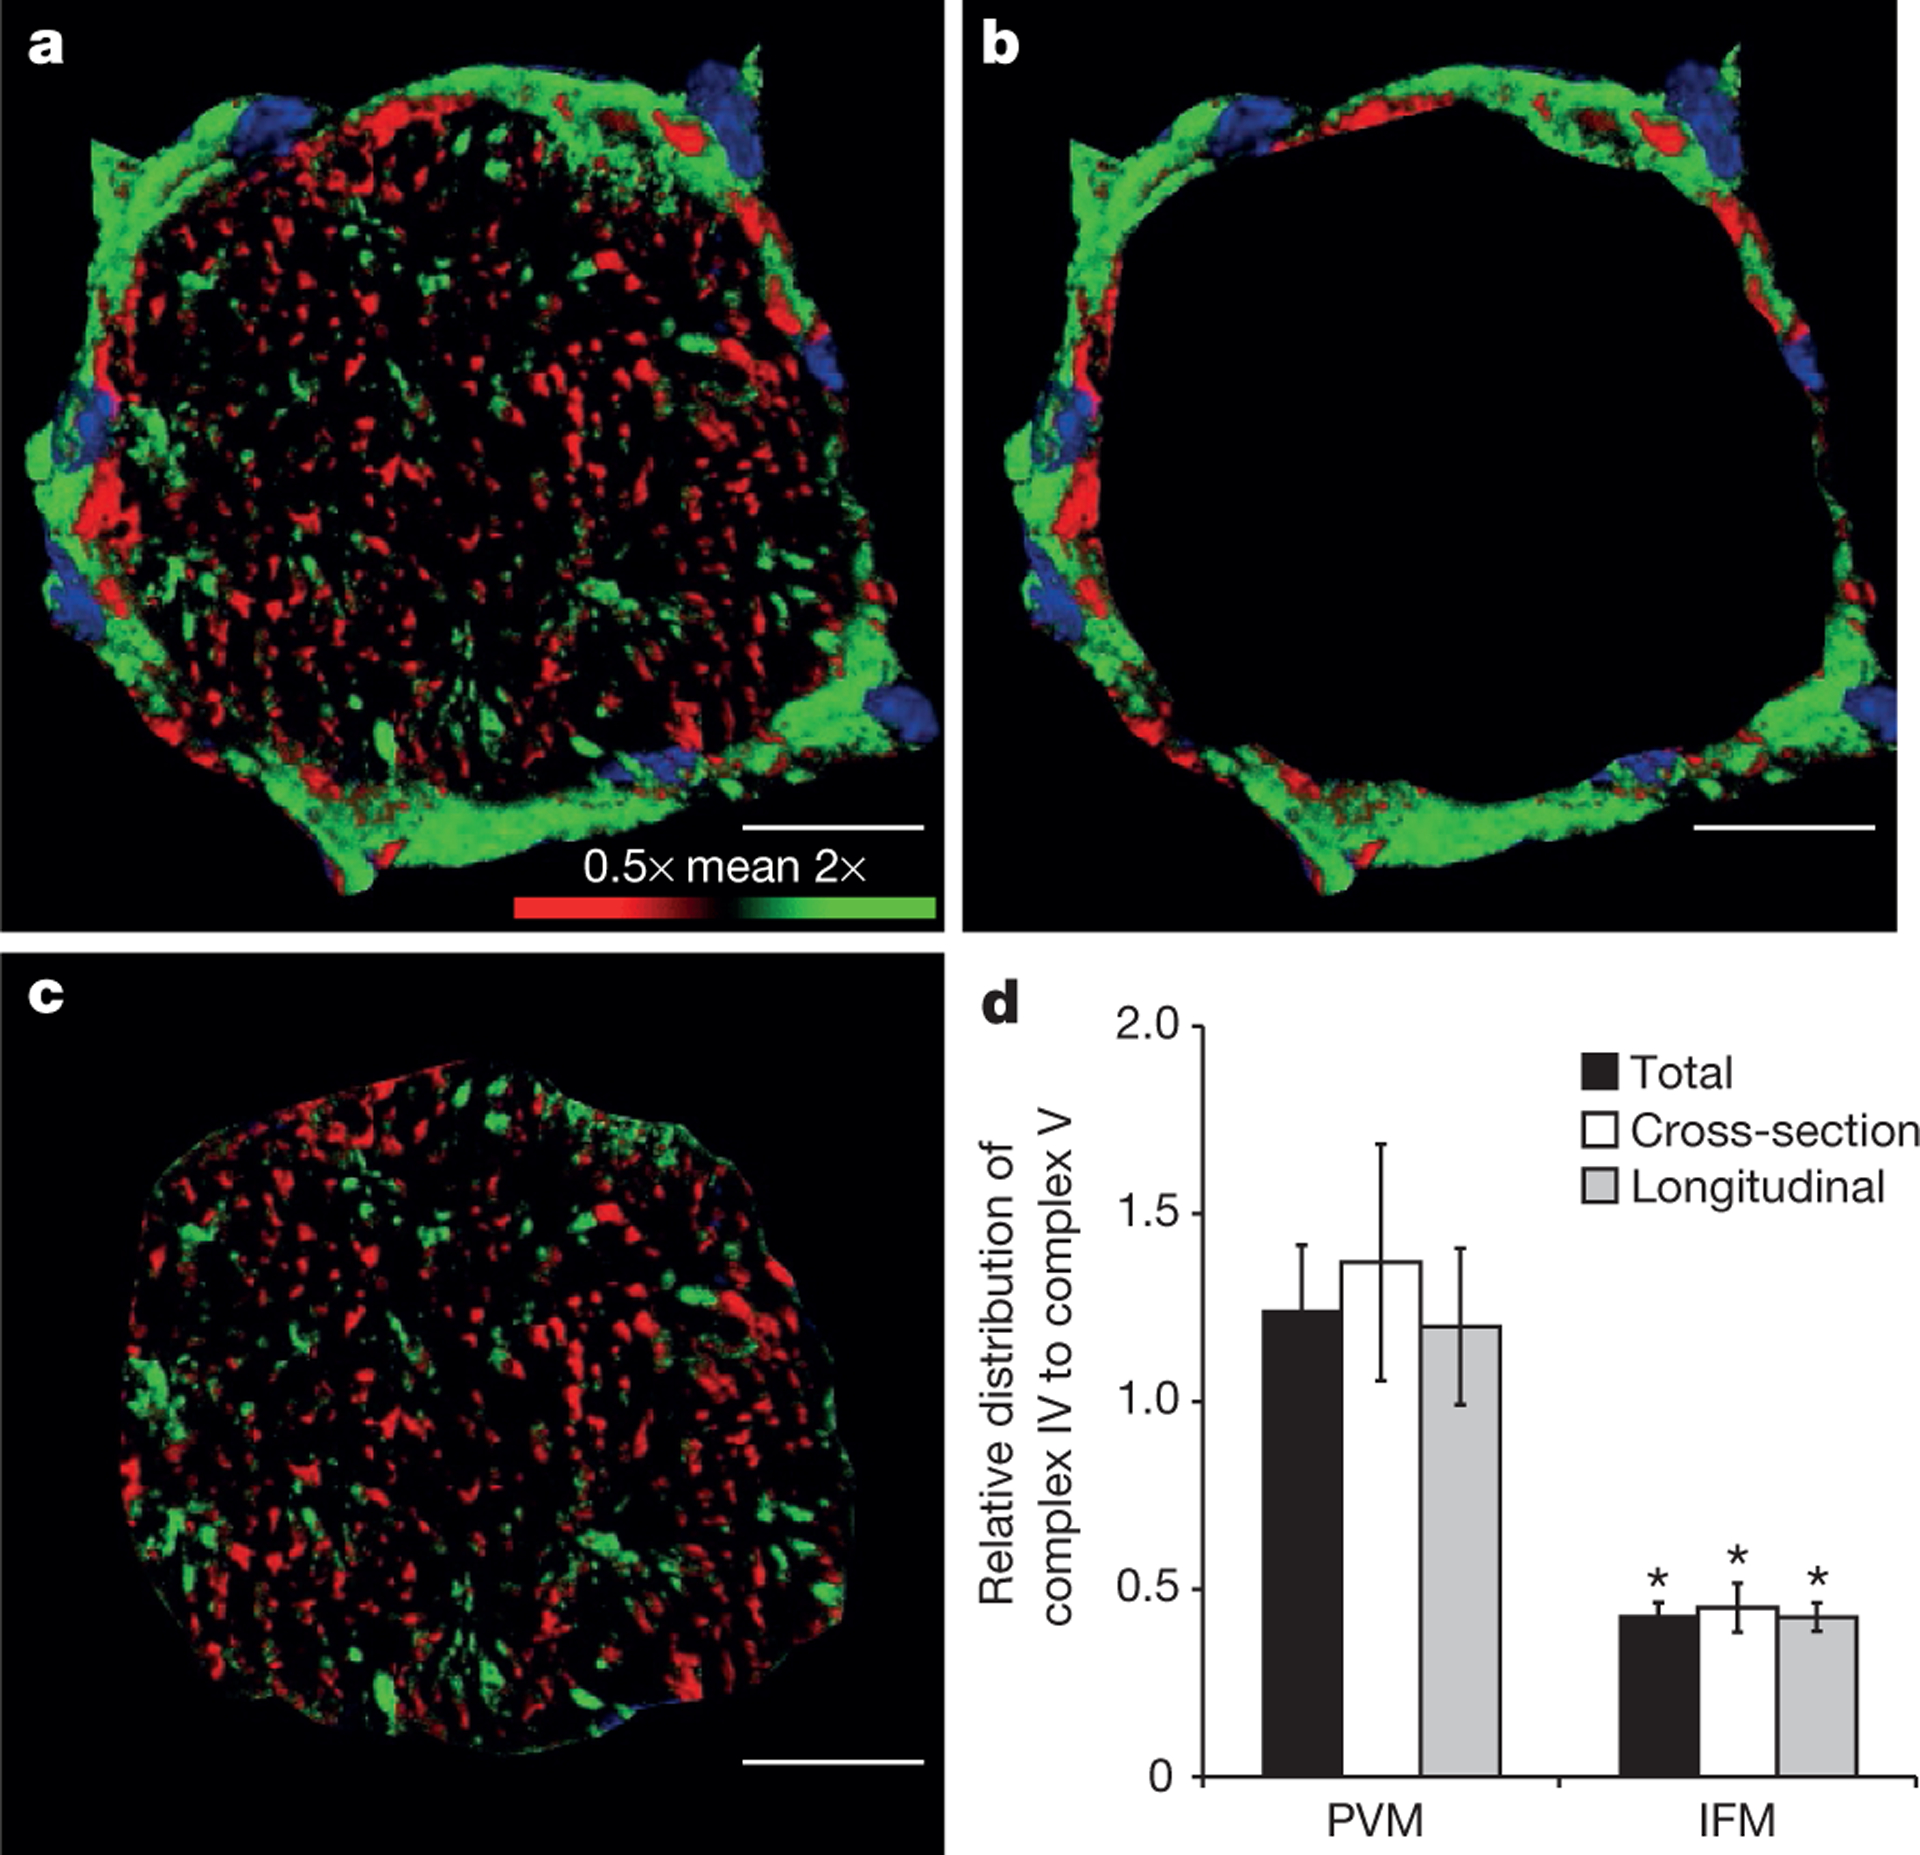
a, 3D rendering of muscle fibre immunostained for both complex IV and complex V. Confocal image coloured according to complex IV/complex V ratio. Relatively higher complex IV, green pixels; relatively higher complex V, red pixels. Nuclei, blue. b, c, Separation of PVM around fibre periphery (b) and IFM (c) within fibre as used for calculations. d, PVM have relatively greater capacity for membrane potential generation while IFM have greater capacity for membrane potential utilization. Images are representative of data from 12 fibres, 5 mice. Error bars indicate standard error. Asterisk indicates significantly different from PVM (paired t-test, P < 0.05). Scale bars, 15 μm.