
Extended Data Figure 1 |. Mitochondrial coupling assessment.
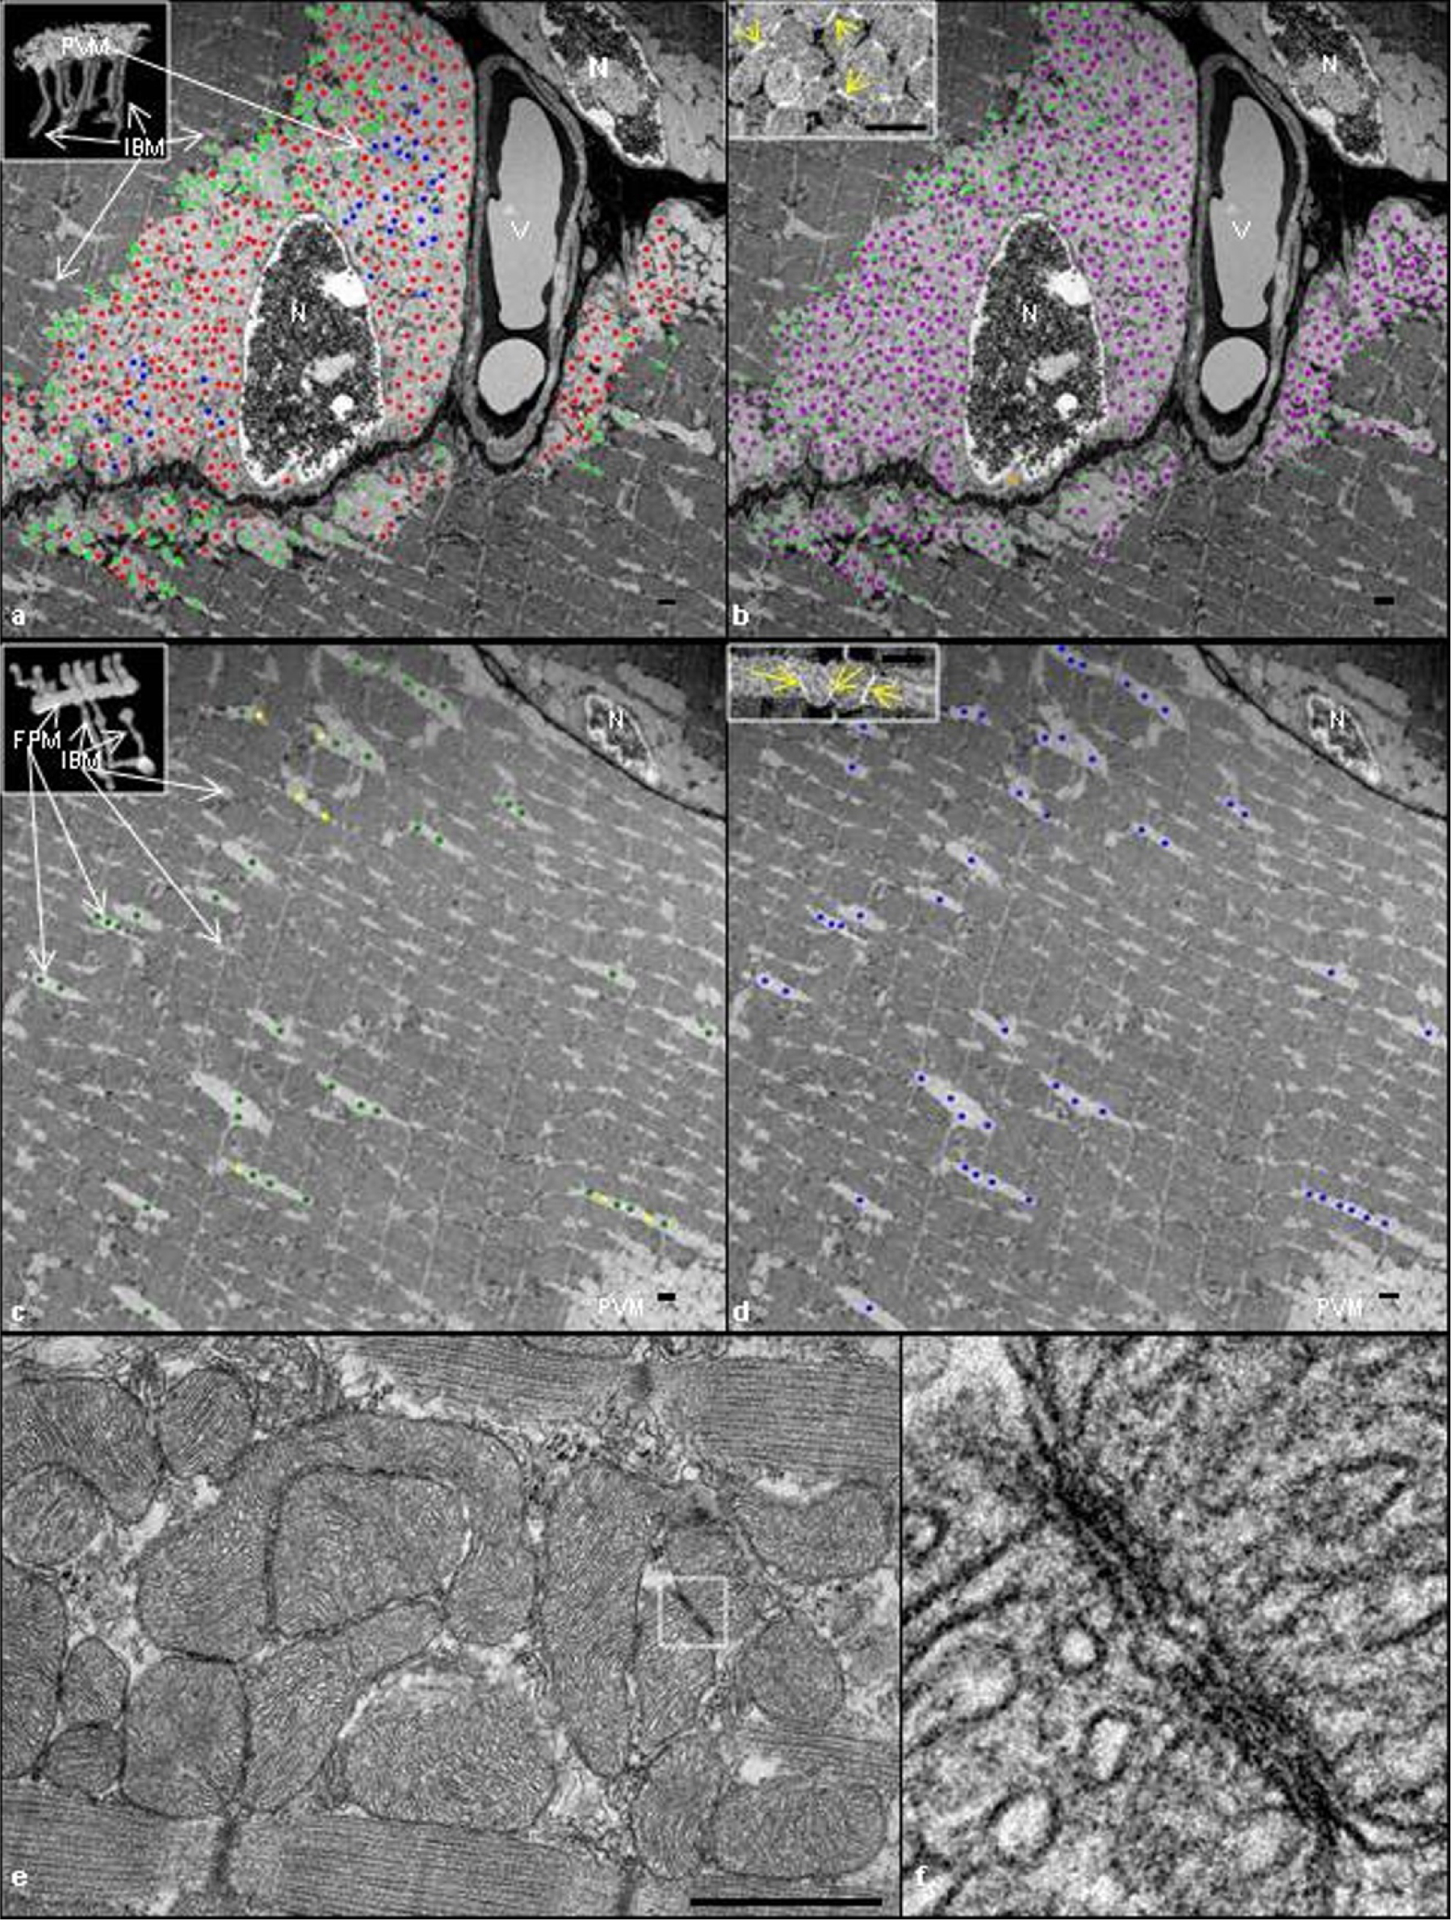
a, b, Single image from the middle of a FIB-SEM muscle volume including two nuclei (N) and a blood vessel (V). a, Direct coupling. PVM tagged green are those where a single mitochondrion projects from a PVM into an IBM with a continuous outer membrane (see inset) within the imaged volume. Red-tagged PVM did not project into IBM. Blue-tagged PVM continued out of the field of view and could not be classified. b, Electron-dense contact site (EDCS) coupling. Magenta-tagged mitochondria were connected by EDCS (see yellow arrows in inset). Additional green dots were added to PVM which project into IBM (see a). Greater than 99% of tracked PVM were coupled by EDCS. c, d, Single image from the middle of the intra-fibrillar region of a FIB-SEM volume. c, Direct coupling. FPM tagged green are those where a single mitochondrion projects from an FPM into an IBM with a continuous outer membrane (see inset). Yellow-tagged FPM did not project into IBM. d, EDCS coupling. FPM tagged blue were connected to an adjacent FPM through an EDCS (see yellow arrows in inset). Images are representative of 4 samples with significant paravascular and intra-fibrillar mitochondrial content from 4 animals. e, A longitudinal TEM mouse tibialis anterior muscle image showing the close association between adjacent mitochondria. f, Close up view of an EDCS highlighted in e showing the convergence of mitochondrial membranes between two adjacent mitochondria. Scale bars, 750 nm.