
Extended Data Figure 2 |. Multi-photon microscopy (MPM) images of fresh muscle fibres in situ.
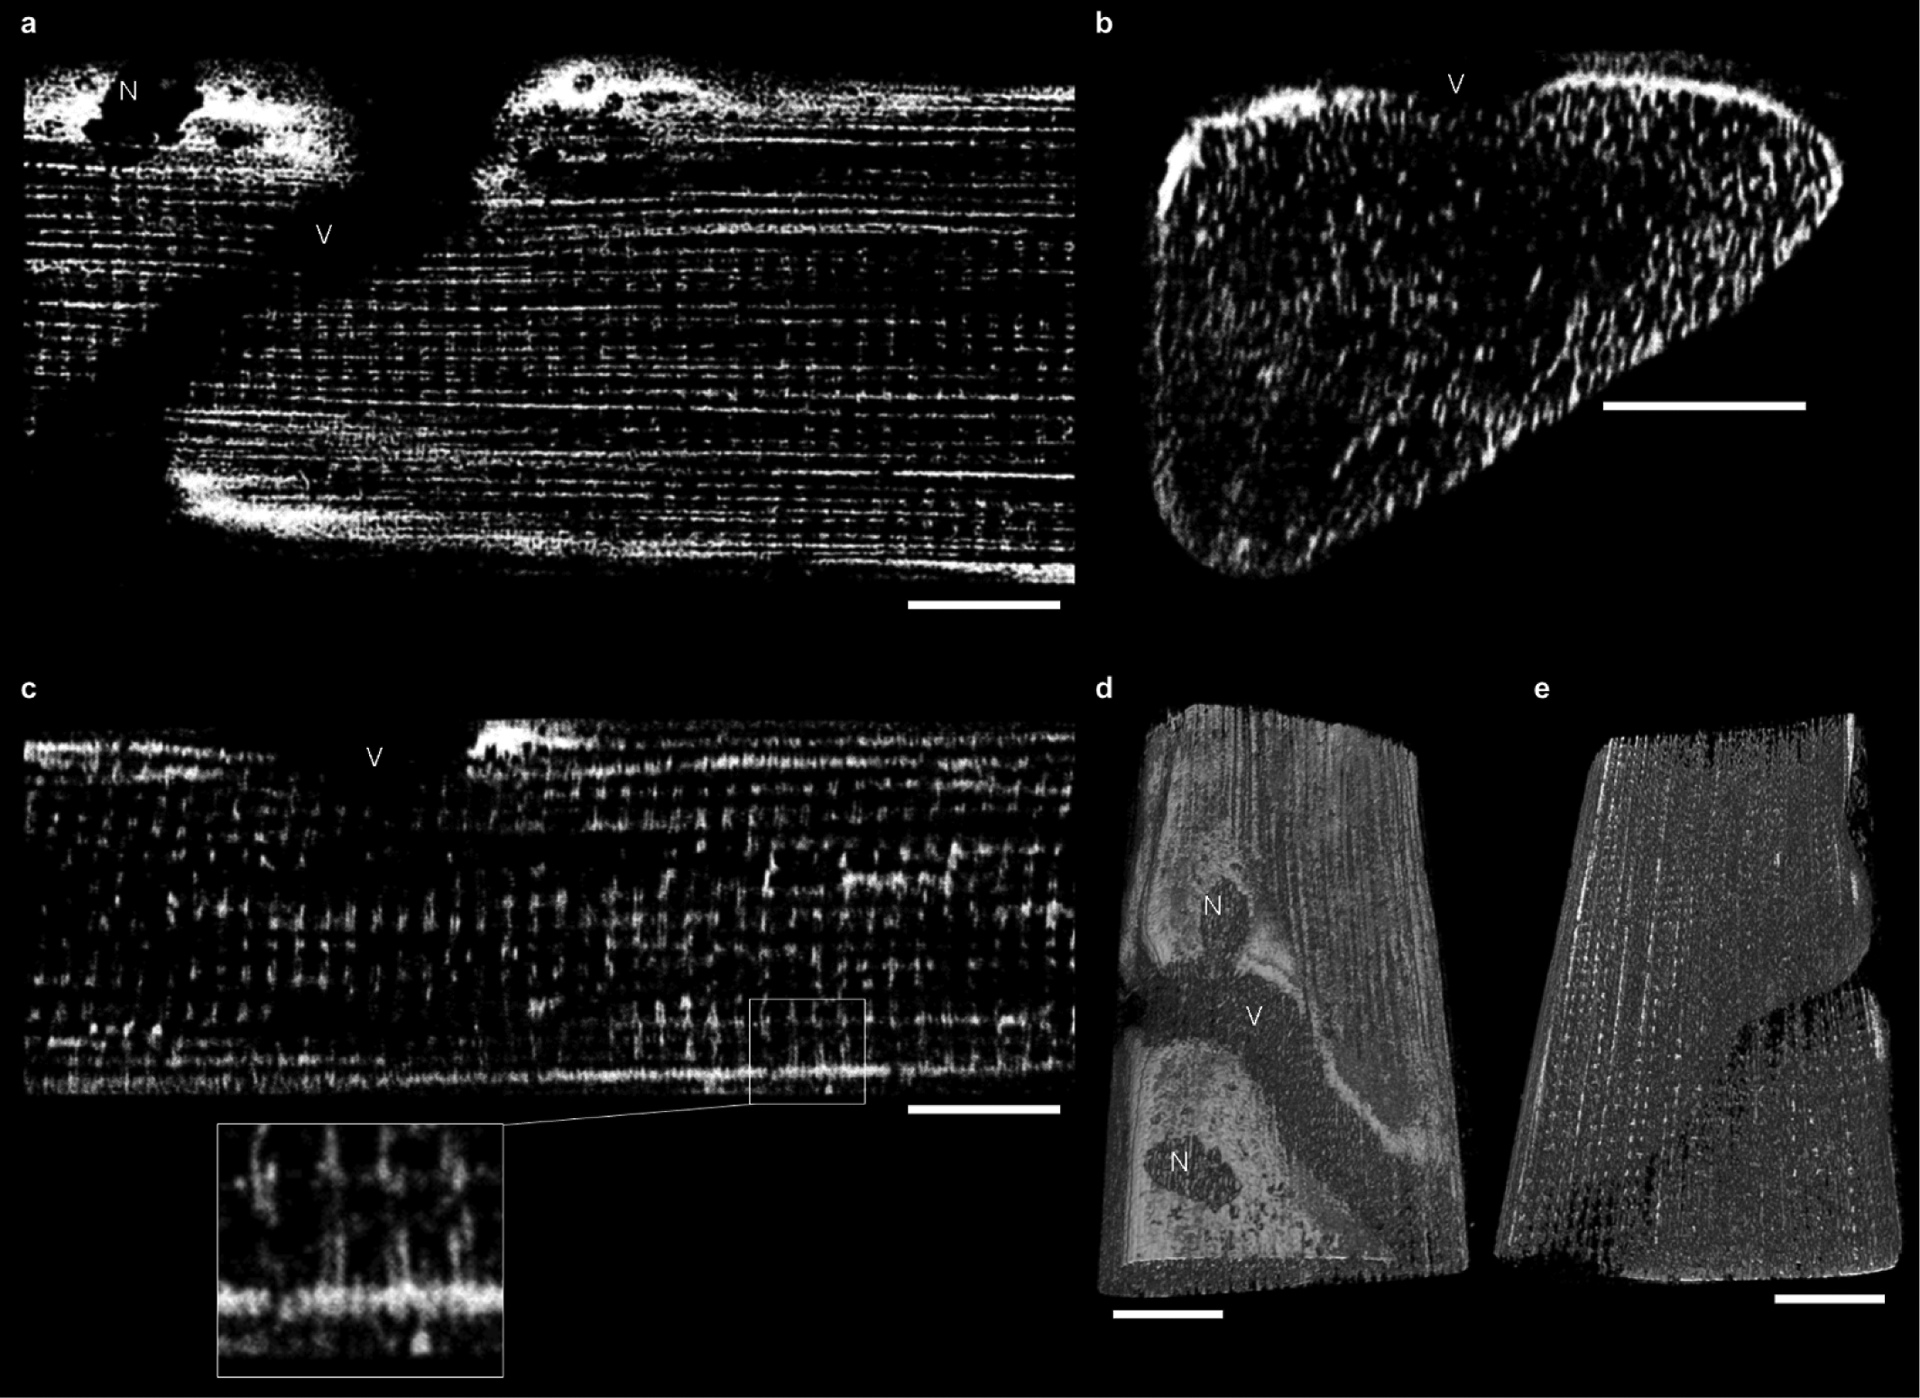
a, Endogenous mitochondrial NAD(P)H signal froma single XY image within a 3D volume of a muscle fibre. In this orientation, paravascular mitochondria (PVM) are apparent as clusters around the embedded capillary (V) and nuclei (N). Fibre parallel mitochondria (FPM) are seen as horizontal lines while I-band mitochondria (IBM) are seen as discrete spots. There are very few vertical lines in this image due to the infrequency of cross-fibre connection mitochondria (CFCM). The full volume can be seen in Supplementary Video 3. b, A YZ image from the same fibre volume asin a. PVM appear lateral to the embedded capillary (V), while IBM appear as vertical lines and FPM are seen as discrete spots. Note the lack of horizontal lines (CFCM) in this image or the accompanying video (Supplementary Video 4). c, An XZ image of the same muscle volume as in a and b. PVM are located on the cell periphery; IBM are seen as vertical lines; FPM are seen as horizontal lines; and CFCM as discrete spots. In the inset, pairs of IBM projecting out from PVM are highlighted. d, A 3D rendering of the endogenous mitochondrial NAD(P)H signal within the muscle fibre shown in a–c. 360° views of this 3D rendering are shown in Supplementary Video 5. e, A viewof the interior of the 3D rendering from d showing the regularity of the mitochondrial network within skeletal muscle. The field of view for the muscle volume in this image is 102.4 × 51.2 × 36.8 μm in x, y and z, respectively. Scale bars, 15 μm. Mean fibre volume from these MPM images was 159,431 ± 15,507 μm3. Images are representative of 4 fibres from 3 mice.