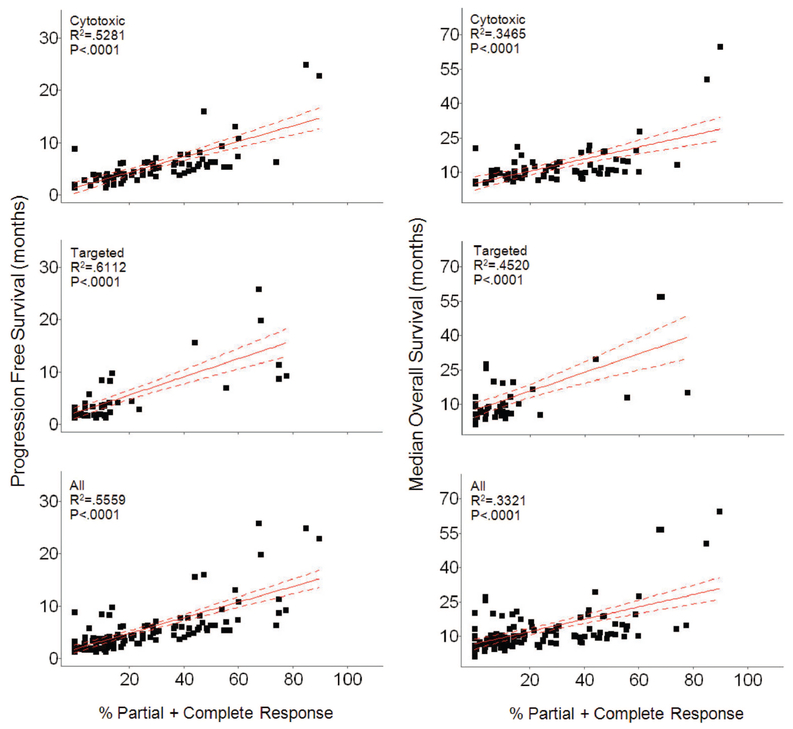
FIGURE 5.
Plots of median PFS (left) and median OS (right) as a function of percent PR + CR. Within each comparison, 3 groups are plotted. Cytotoxic refers to the group of studies where patients received cytotoxic therapy, targeted therapies refers to the group of studies where patients received targeted therapies and All refers to patients from both the cytotoxic and targeted therapies groups combined. In all plots, Percent PR + CR is significantly correlated (P < 0.0001) with both median PFS and median OS.

