
Figure 3.
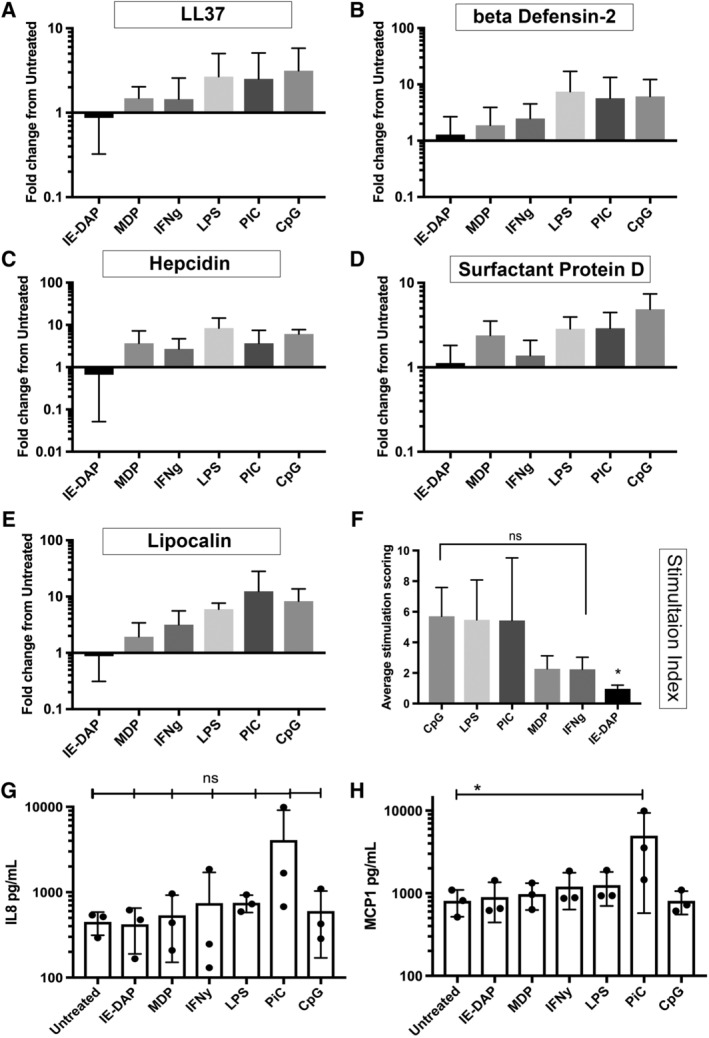
Effects of mesenchymal stem cells (MSC) activation with TLR ligands and cytokines on antimicrobial peptide (AMP) expression, as assessed by RT‐PCR. Gene expression in response to in vitro activation with stimuli, as noted in the Materials and Methods section. Stimulant 1: γ‐D‐Glu‐mDAP (IE‐DAP) and a negative control muramyl dipeptide (MDP); Stimulant 2: cytokine IFN‐γ (IFNg); Stimulant 3: lipopolysaccharide (LPS); Stimulant 4: poly‐inosinic, poly‐cytidylic acid (pIC). Stimulant 5: type B CpG oligonucleotide (CpG). The y‐axis depicts fold change in gene expression, calculated using ddCT method32 normalized to un‐stimulated MSC and housekeeping gene GAPDH. A, LL37 expression; B, beta defensin2 expression; C, hepcidin expression; D, surfactant protein D expression; E, Lipocalin. Figures depict average fold change in AMP expression, as assessed in three donor MSC. Error bars depicting mean of three technical replicates from three donor MSC with SD. F, Stimulation index depicting average fold changes of the expression of five AMP genes, ranked in order of most to least effective AMP upregulation stimuli. Error bars depicting mean with SD. G, IL‐8 secretion in response to activation. MSC were activated with the stimuli noted, then conditioned medium (CM) was collected 24 hours later and IL‐8 concentrations were determined using an IL‐8 ELISA, as noted in the Materials and Methods section. H, MCP‐1 secretion in response to MSC activation. MSC were activated with the stimuli noted, then CM was collected 24 hours later and MCP‐1 concentrations were determined using a specific ELISA, as noted in the Materials and Methods section. Each point on the cytokine graphs represents the mean of three technical replicates obtained from MSC generated from three different donors. * denotes P < .05 as assessed by ANOVA and Tukey multiple means post‐test