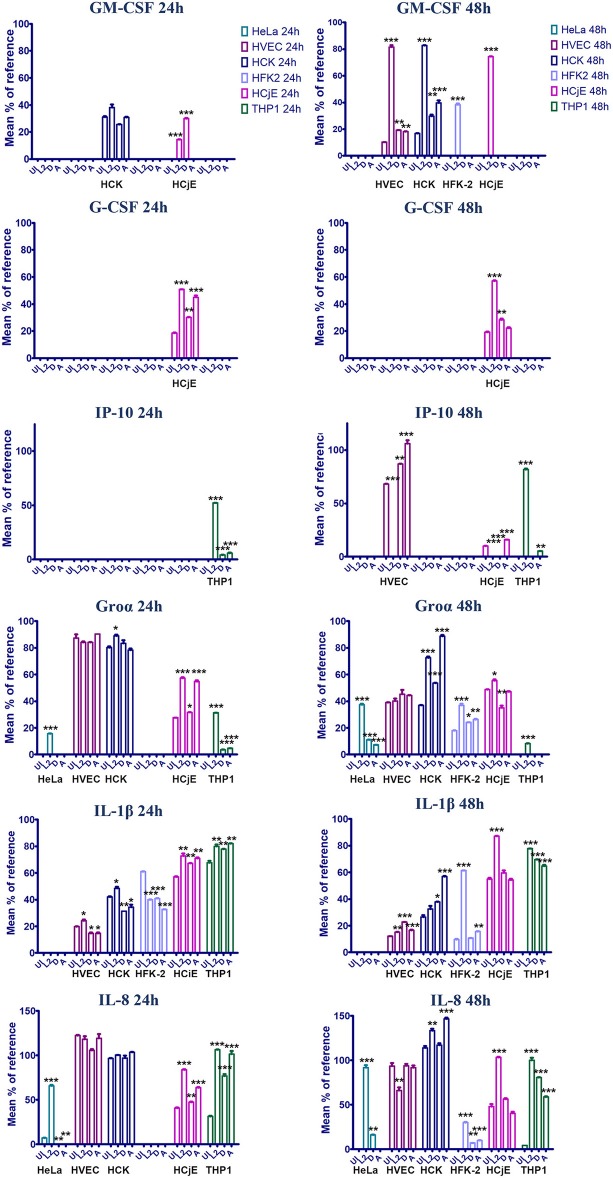
Figure 4.
GM-CSF, G-CSF, Groα, IL-1β, IL-8 production in HVEC, HCK, HFK-2, and HCjE cells infected with C. trachomatis serovar L2, D, or A for 24 or 48 h. Cells were infected at an MOI of 1 with each serovar and at 24 or 48 h post-infection cytokine production was assessed using the human proteome profiler array. Signal was normalized to reference spot as described in the materials and method section and the signal percentage was expressed as a mean percent to the reference. Asterisks indicate significant differences between uninfected cells and infected cells. One-Way AVOVA was used to determine statistical significance (*P ≤ 0.05, **P ≤ 0.01, ***P ≤ 0.001).

