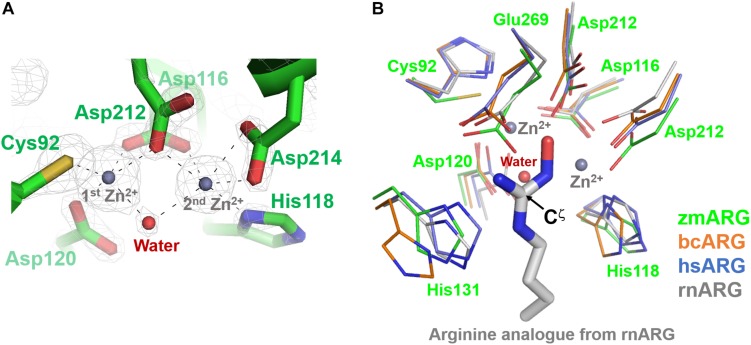
FIGURE 2.
Active site of zmARG. (A) 2Fo–Fc electron density map (contoured at 3.0 σ level) in the active site. Interaction between the zinc ions and protein atoms are indicated with black-dotted lines. Protein side chains are drawn with stick models. Two bound zinc ions and a water molecule bridging two zinc ions are displayed with gray and red spheres, respectively. (B) Comparison of the zmARG site with those of bcARG, hsARG, and rnARG. Active site residues of thin stick models are differentiated by colors. The substrate analog N-omega-hydroxyl-l-arginine bound to rnARG is shown as thick stick models. The zinc ions (gray) and water molecule (red) are drawn by spheres.

