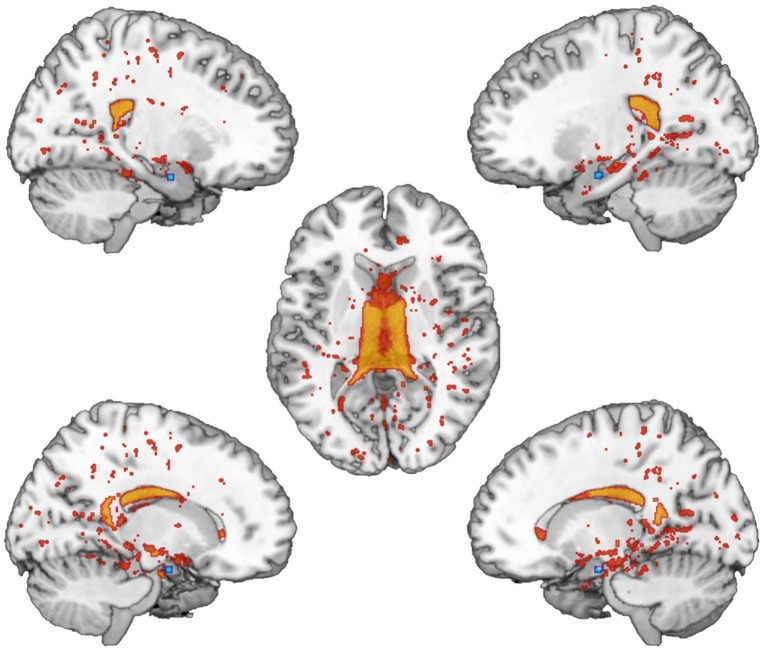
Figure 2.
IC08 Pattern. The figure depicts the covariance pattern of IC08 resulting from joint ICA. Statistical maps are thresholded at z = 2.5 for visualization purposes. Gray-matter clusters and white-matter clusters including all DTI metrics (i.e., FA, MD, AD, RD) are shown in blue-green and red-yellow colors, respectively.

