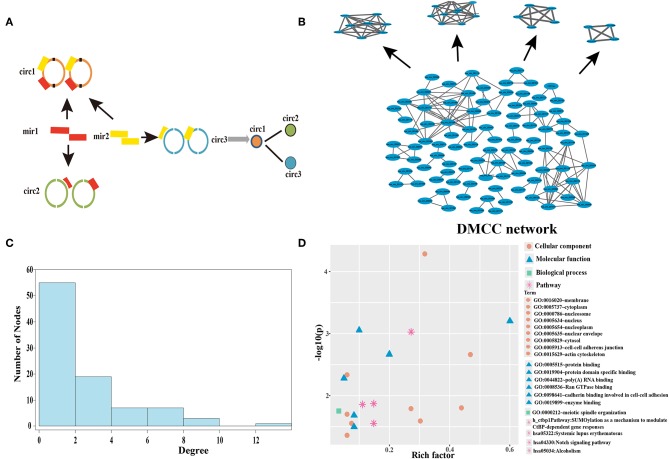
Figure 2.
Establishment and analysis of DMCC network in the breast cancer. (A) The construction of the circRNA crosstalk (CC) network. The orange, green, and blue represent three different circRNAs, and the red and yellow rectangles are two miRNAs. (B) The DNA methylation mediated circRNA crosstalk (DMCC) network and candidate circRNAs. The blue nodes represent circRNAs. (C) Degree distribution of DMCC network. (D) The function and pathway enrichment analysis of circRNA host genes in the DMCC network. The abscissa represents the rich factor, and the ordinate represents the inverse of the logarithm of the P-value corrected by Benjamini. The larger value represents the significant of GO terms and pathway.

