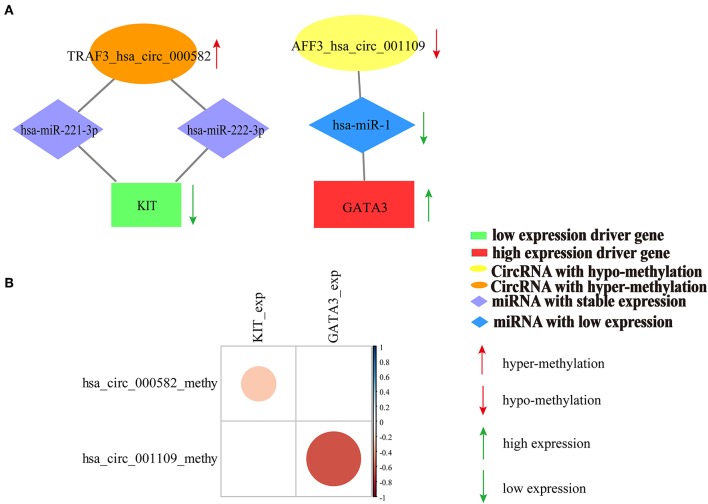
Figure 7.
Relationship between the DNA methylation of the predicted two sponge circRNAs (hsa_circ_000582, hsa_circ_001109) and expression of their sponge driver genes (KIT, GATA3). (A) Competition interaction diagram of the predicted two sponge circRNAs (hsa_circ_000582, hsa_circ_001109) and their sponge driver genes (KIT, GATA3). (B) The correlation coefficient diagram of DNA methylation of the predicted two sponge circRNAs (hsa_circ_000582, hsa_circ_001109) and expression of their sponge driver genes (KIT, GATA3). The scalable size of circles in correlation coefficient diagram represent the absolute value of the correlation coefficient.

