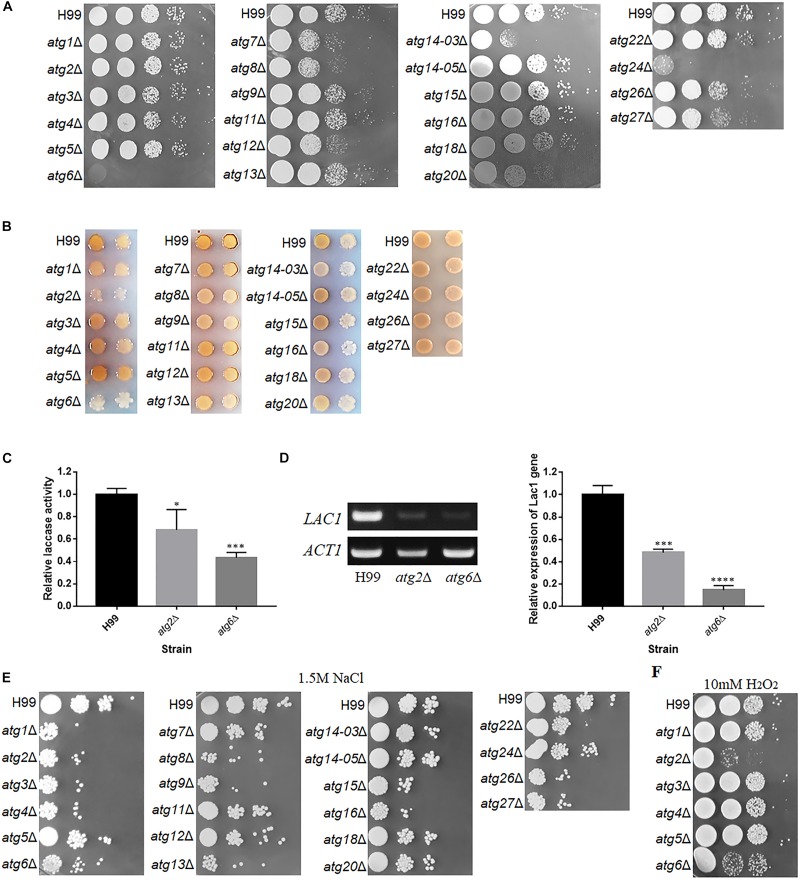
FIGURE 4.
Phenotypes of atgΔ mutants of C. neoformans. (A) Thermotolerance test. Serial 10-fold dilutions of H99 and atgΔ strains were spotted onto YPD medium and incubated at 37°C. (B) Laccase activity assay to determine melanin production. Each strain was spotted and cultured on Asn medium containing 0.1% glucose and 100 mg/L norepinephrine at 30°C for 3 days. (C) Relative laccase activity of H99, atg2Δ and atg6Δ strains using ABTS as a substrate. The assay was performed three times. Asterisks indicate significant differences between the wild-type (H99) and mutant strains (∗P < 0.05; ∗∗∗P < 0.001; Student’s t-test). (D) Qualitative and quantitative analysis of LAC1 expression in atg2Δ and atg6Δ by reverse transcription PCR (RT-PCR) and quantitative real-time (qRT-PCR) upon induction by 0.1% glucose for 5 h. The assay was performed three times. Asterisks indicate significant differences (∗∗∗P < 0.001; ****P < 0.0001; Student’s t-test). (E,F) Sensitivity of atgΔ to NaCl and H2O2. Serial 10-fold dilutions of H99 and atgΔ strains were spotted on agar plates containing 1.5 M NaCl or 10 mM H2O2 and incubated at 30°C.

