Figure 1.
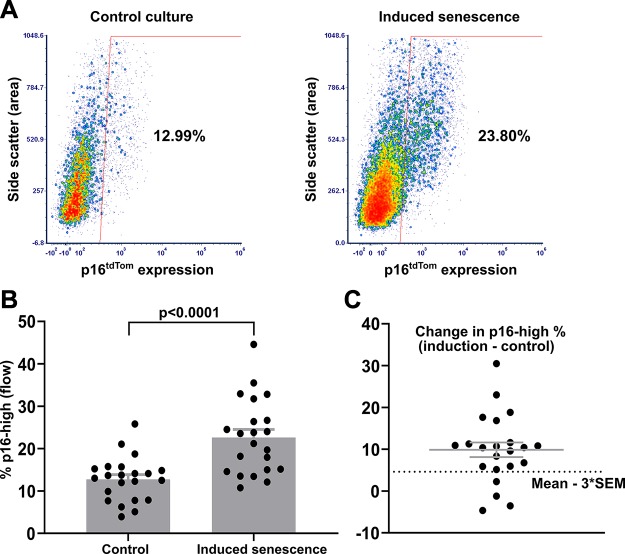
Induction of p16tdTom in hip cartilage explant cultures. A) Representative flow plots showing the percentage of p16-high cells after 3 wk of explant culture. Senescence-induction conditions added 1 ng/ml TGF-β1 and 5 ng/ml bFGF to control conditions. B) Quantification of p16-high cells in matched explants from 22 mice (1 hip control; 1 hip induced senescence per mouse). C) The change in percentage of p16-high cells with senescence-induction conditions as compared with control conditions within each pair of explants (percentage in induction conditions minus percentage in control conditions). Solid lines indicate means ± sem. The dotted line indicates a senescence-induction threshold of the mean − 3 × sem.

