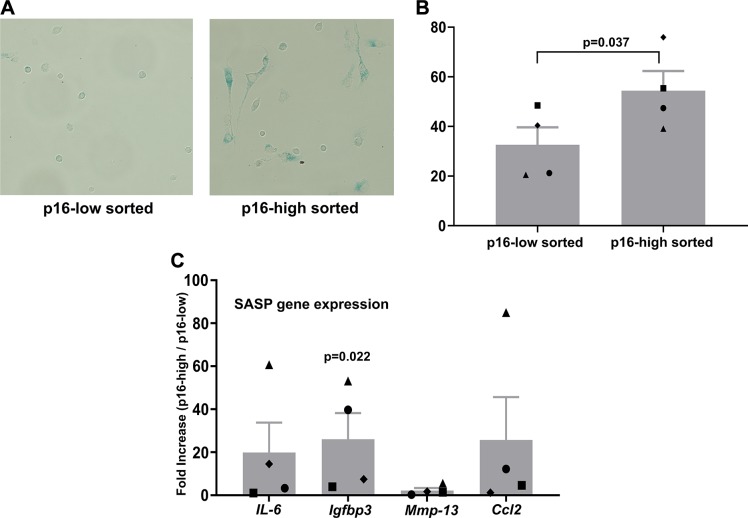
Figure 4.
SA-β-gal activity in chondrocytes sorted based on p16tdTom levels. A) Representative image of SA-β-gal staining from cells sorted as either p16 low or p16 high. B) Quantification of the percentage of cells showing positive staining for SA-β-gal in each population. Matched symbols indicate cells sorted simultaneously into the p16-low or p16-high populations. C) SASP gene expression from explants cultured for 3 wk in 2% oxygen with growth factors to induce senescence. Cells were sorted and the data represent the fold increases for the p16-high fraction as compared with the p16-low fraction for each gene.

