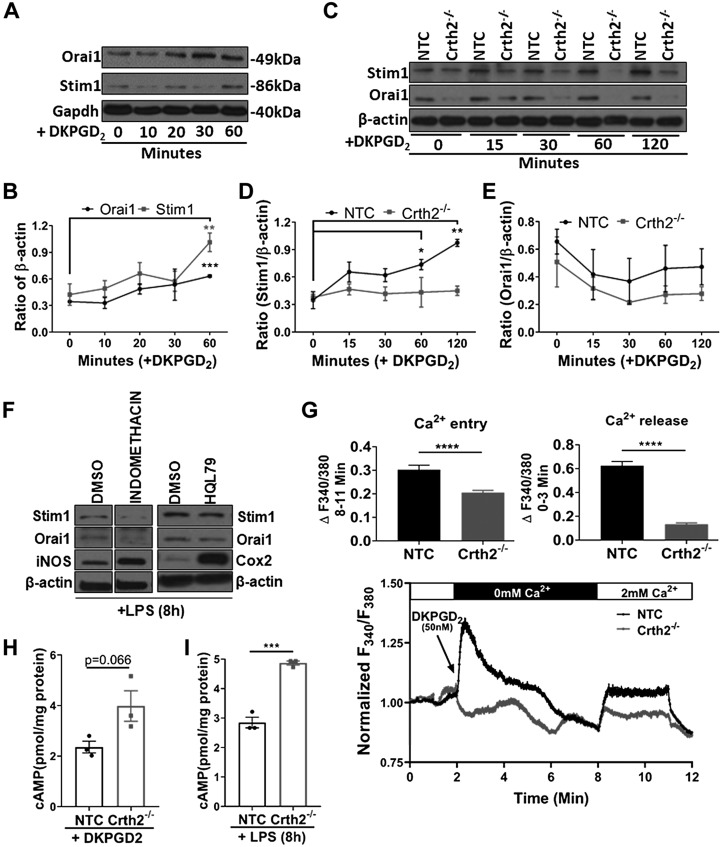
Figure 5.
DKPGD2-mediated Ca2+ release and entry are abrogated in Crth2−/− RAW264.7 cells. A, B) Representative immunoblot (A) and quantitation (B) of Stim1 and Orai1 at 0, 10, 20, 30, and 60 min after DKPGD2 (50 nM) treatment of BMDMs. Glyceraldehyde 3-phosphate dehydrogenase (Gapdh) is used as loading control. C–E) Representative immunoblot (C) and quantitation of Stim1 (D) and Orai1 (E) in NTC and Crth2−/− RAW264.7 cells after DKPGD2 stimulation for 0–120 min. β-actin is used as loading control. P value is in comparison with expression in unstimulated cells. F) Representative blot showing expression of Stim1, Orai1, iNOS, and Cox2 in BMDMs pretreated with indomethacin (1 μM) or HQL79 (25 μM) followed by LPS stimulation for 8 h. G) Original traces show cytosolic Ca2+ signals after stimulation of NTC or Crth2−/− RAW264.7 cells by DKPGD2. These cells were loaded with Fura2-AM and stimulated with 50 nM DKPGD2 in HBSS (without extracellular calcium) to assess Ca2+ release followed by the addition of CaCl2 (2 mM extracellular calcium) to determine the extent of Ca2+ entry through SOCE. SOCE was also monitored after addition of the SOCE inhibitor Gd3+ (5 µM). Results are represented as means ± sem from 3 independent measurements, and the magnitude of Ca2+ release and Ca2+ entry signals was quantified (see inset). H) Levels of intracellular cAMP concentrations in response to DKPGD2 treatment for 15 min in NTC and Crth2−/− RAW264.7 cells. I) Intracellular cAMP levels measured at 8 h after LPS stimulation in NTC and Crth2−/− RAW264.7 cells. P value is in comparison with levels of cAMP in NTC RAW264.7 cells. *P < 0.05, **P < 0.01, ***P < 0.001 (Student’s t test; n = 3 independent experiments).

