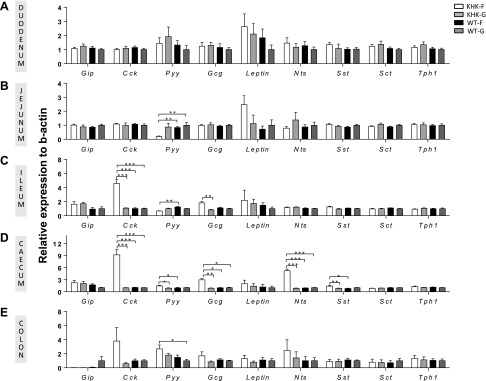
Figure 1.
KHK−/− and WT mice were fed 20% fructose (KHK-F or WT-F) or 20% glucose diet (KHK-G or WT-G) for 8 wk. The mRNA expression levels of the main entero-hormones were measured in KHK-F, KHK-G, WT-F, and WT-G mice in the duodenum (A), the jejunum (B), the ileum, (C), the cecum (D), and the proximal colon (E). The relative values were normalized to WT-G levels (n = 6–8/group). All values are means ± sem. Means were compared by 1-way ANOVA followed by Tukey’s post hoc test. *P < 0.05, **P < 0.01, ***P < 0.001.

