Figure 3.
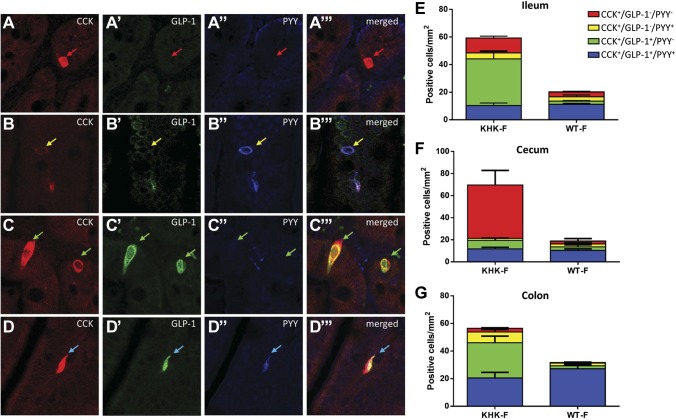
KHK−/− and WT mice were fed 20% fructose (KHK-F or WT-F) for 8 wk. A–D‴) Representative triple-immunofluorescence staining of CCK (red), GLP-1 (green), and PYY (blue) in the ileum of KHK-F mice. Each set of panels (e.g., A–A‴) shows the same field of view with CCK, GLP-1, and PYY channels separately and a merged image. Red arrows show EECs in which CCK only is expressed (CCK+/GLP-1−/PYY−), yellow arrows show EECs in which CCK and PYY are both expressed (CCK+/GLP-1−/PYY+), green arrows show EECs in which CCK and GLP-1 are both expressed (CCK+/GLP-1+/PYY−), and blue arrows show EECs in which CCK, GLP-1, and PYY (CCK+/GLP-1+/PYY+) are expressed. E–G) Quantification of the density of the different populations of CCK+ cells in the ileum (E), cecum (F), and colon (G) of KHK-F and WT-F (n = 5–6/group). All values are means ± sem. The counts and statistics are presented in Supplemental Table S3.

