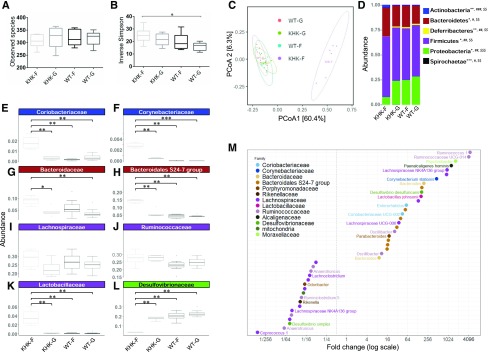
Figure 4.
Microbiota composition of the cecum content collected from KHK−/− or WT mice fed 20% fructose (KHK-F or WT-F) or 20% glucose (KHK-G or WT-G) diet for 8 wk (n = 6–8/group). Analysis was based on 16S rDNA sequencing (region V3-V4). A, B) Observed species richness (A) and inverse Simpson index (B) as indicators of α-diversity. C) Principal coordinates analysis (PCoA) of Bray-Curtis compositional dissimilarity at the OTU level. D) Mean relative abundance at phylum level in cecum content of each group. E–L) The most abundant families from Actinobacteria (E, F), Bacteroidetes (G, H), Firmicutes (I–K), and Proteobacteria (L) phyla. M) Graphic representation of differentially abundant OTUs between KHK-F and WT-F having a large (FC >8 or FC <1/8) and significant (P < 0.001) effect size in addition to high relative abundances (>0.1% in at least half the samples). Each OTU is represented by a dot and colored according to its taxonomic classification at the family level. Taxonomy at the genus or species level is also indicated, when available, next to each OTU. A logarithmic scale (log-2) was used for the x axis. Observed species richness and inverse Simpson index values are means ± sem. Means were compared by 1-way ANOVA followed by Tukey’s post hoc test. *P < 0.05. For D, the mean of each group is represented along the x axis and the y axis refers to relative normalized abundances. Phylum relative abundance data were compared using Kruskal-Wallis test. *P < 0.05, **P < 0.01, ***P < 0.001 indicating significantly different phyla abundances between KHK-F and KHK-G, #P < 0.05, ##P < 0.01, ###P < 0.001 between KHK-F and WT-F, and $$P < 0.01, $$$P < 0.001 between KHK-F and WT-G (significance adjusted for false-discovery rate of P < 0.05). For E–L, the y axis refers to relative normalized abundances, and the lines indicate median and the boxes indicate first and third quartiles. Family abundance data were compared using the Wilcoxon test. *P < 0.05, **P < 0.01 when compared with KHK-F.

