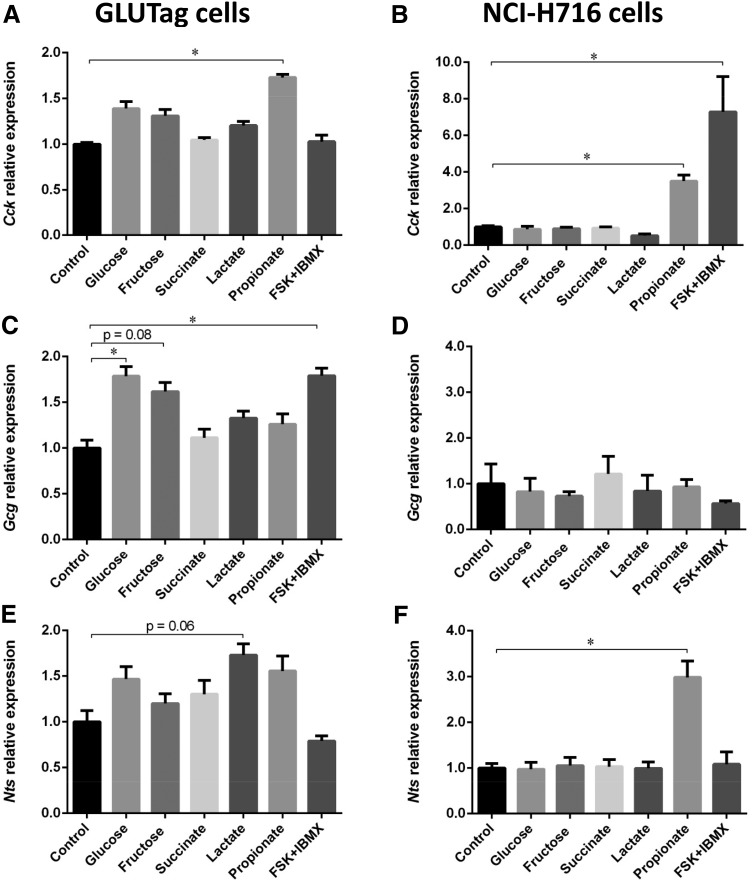
Figure 8.
Cck (A, B), Gcg (C, D), and Nts (E, F) mRNA expression in GLUTag and NCI-H716 cells, respectively, incubated for 24 h with 1 mM glucose (control) or 25 mM glucose, 25 mM fructose, 2 mM succinate, 10 mM lactate, 2 mM propionate, or 25 mM glucose + 10 μM forskolin + 10 μM 3-isobutyl-1-methylxanthine (FSK/IBMX) (n = 3/group for GLUTag and n = 4/group for NCI-H716). The relative values were normalized to control levels. All values are means ± sem. Means were compared by Kruskal-Wallis test followed by Dunn’s multiple comparison test. *P < 0.05.

