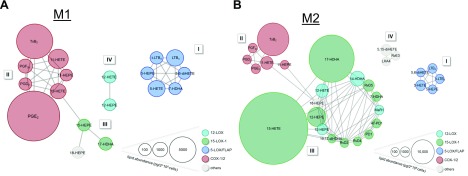
Figure 6.
Network of coregulated eicosanoids and docosanoids in M1 and M2 macrophages. M1 (A) and M2 cells (B), corresponding to 2 × 10⁶ cells/ml, were treated with vehicle (0.1% DMSO) or test compounds 15 min before challenge with E. coli (O6:K2:H1; ratio 1:50) for 180 min at 37 °C. LMs were isolated by SPE and analyzed by UPLC-MS-MS. Visualization of positive LM/LM correlations as circular network with r ≥ 0.7. Nodes visualize the LM; for color and size meanings see legend.

