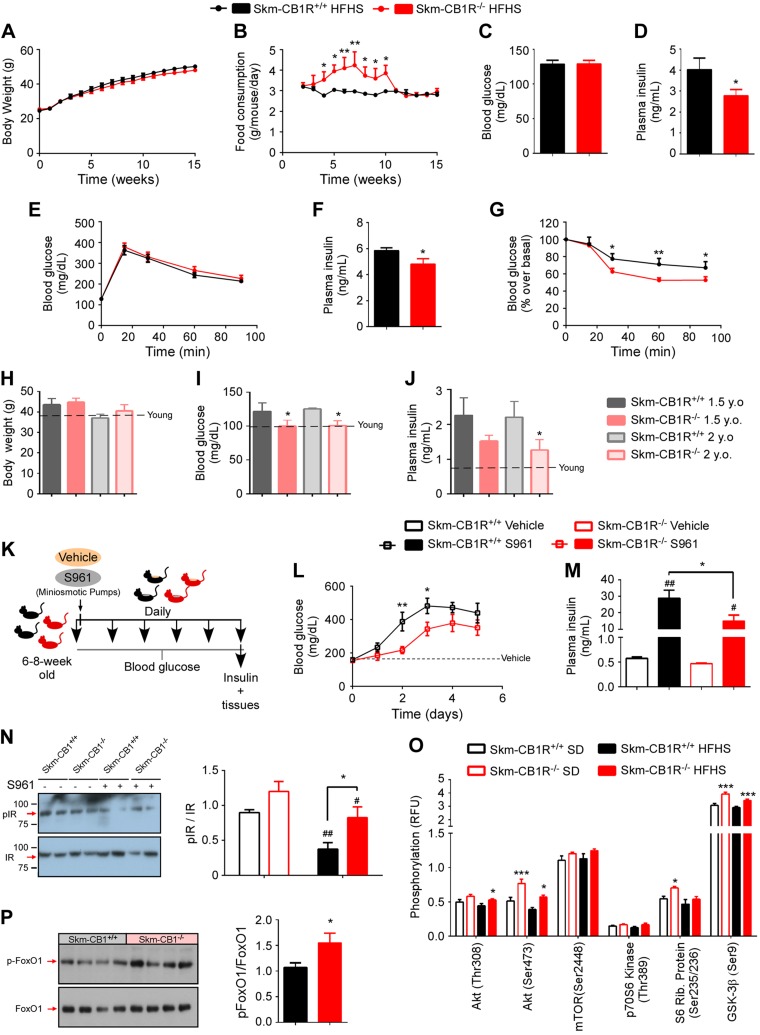
Figure 2.
Skm-CB1R−/− mice are protected from insulin resistance compared with Skm-CB1R+/+ mice. Skm-CB1R−/− and Skm-CB1R+/+ male mice (6–8 wk old) were fed an HFHS for 3 mo. A–G) Body weight (A) and food consumption (B) over the course of 15 wk. Fasting blood glucose (C) and fasting plasma insulin (D) levels after 15 wk. Blood glucose during an IPGTT (E), plasma insulin 15 min after glucose administration (F), and ITT after 15 wk of HFHS (G) (n = 9 mice). Data show means ± sem. F = 9.6, F = 25.8, F = 10.1. *P ≤ 0.05, **P ≤ 0.01 (ANOVA or Student’s t test). H–J) Skm-CB1R+/+ and Skm-CB1R−/− mice were aged up to 2 yr. Body weight (H), fasting blood glucose (I), and fasting plasma insulin (J) levels were measured at 1.5 and 2 yr of age. Dotted line shows levels at 6 mo of age (n = 6–17 mice). Data show means ± sem. *P ≤ 0.05 compared with Skm-CB1R+/+ mice (Student’s t test). K) Male mice (6–8 wk old) were continuously infused with S961, an IR antagonist, for 5 d. L) Circulating blood glucose was measured daily. M) Circulating plasma insulin at d 5 of S961 or vehicle infusion. N) Postmortem analysis (d 5 of S961 or vehicle infusion) of insulin signaling in Skm-CB1R+/+ and Skm-CB1R−/− quadriceps by Western blot for phospho-IR and total IR (n = 6–7 mice). Data show means ± sem. F = 5.6. *P ≤ 0.05 compared with Skm-CB1R+/+ mice, #P ≤ 0.05, ##P ≤ 0.01 compared with vehicle (ANOVA or Student’s t test). O) Quantification of protein phosphorylation downstream of insulin in skeletal muscle (gastrocnemius) from SD- (empty bars) or HFHS-fed (filled bars) Skm-CB1R+/+ and Skm-CB1R−/− mice as measured by phosphoprotein array. P) Western blot for phospho-FoxO1 and total FoxO1 and densitometry quantification (n = 6–9 mice each run in duplicates). P, phosphorylated; Rib, ribosomal; RFU, relative fluorescence units. Data show means ± sem. *P ≤ 0.05, **P ≤ 0.01, ***P ≤ 0.001 compared with Skm-CB1R+/+ mice (Student’s t test).

