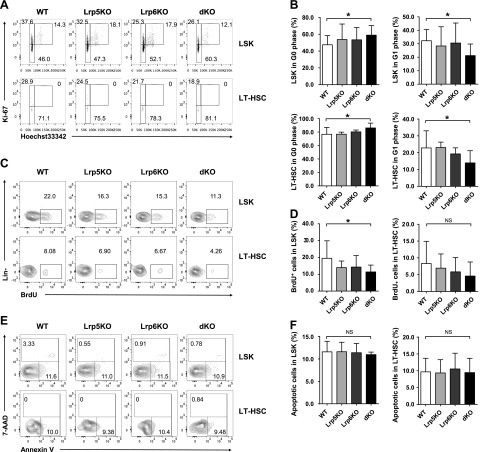
Figure 3.
Lrp5 and -6 are essential for maintaining HSC quiescence. A, B) Cell cycle analysis of LSK cells and LT-HSCs. BM cells were surface stained followed by intracellular staining of Ki67 and Hoechst33342. A) The percentages of G0 (HoechstloKi67−), G1 (HoechstloKi67+), and S/G2/M (Hoechstmed-hiKi67+) phase cells in LSK cells (top row) and LT-HSCs (bottom row) are shown in representative dot plots. B) Cumulative data of G0 and G1 status in LSK cells and LT-HSC subsets (n ≥ 6). C, D) BrdU incorporation assay of LSK cells and LT-HSCs. BM cells were surface stained first and intracellularly stained with BrdU. The percentages of BrdU+ cells in LSK cells (top row) and LT-HSCs (bottom row) are shown in representative contour plots (C). Cumulative data (D) of BrdU+ cells in LSK cells and LT-HSC subsets (n ≥ 8). E, F) Analysis of apoptosis in LSK cells and LT-HSCs. BM cells were surface stained and were further stained with 7-AAD and Annexin V. The percentage of apoptotic cells (Annexin V+7-AAD−) and dead cells (Annexin V+7-AAD+) in LSK cells (top row) and LT-HSCs (bottom row) are shown in representative contour plots (E). Cumulative data (F) of apoptotic cells in LSK cells and LT-HSC subsets are shown. Data are representative of 3 (A, B) or 4 (C–F) independent experiments (mean ± sd) (n ≥ 9). NS, not significant. *P < 0.05, by Student’s t test.

