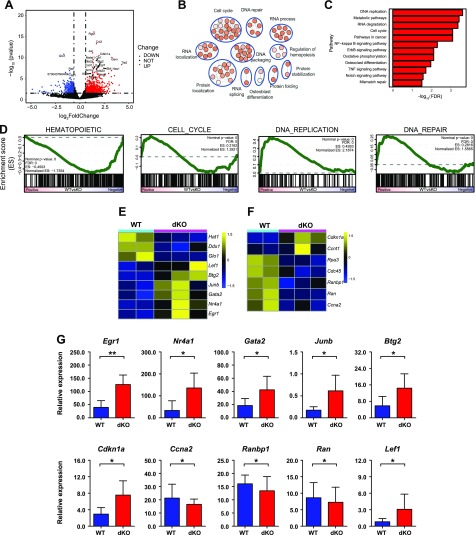
Figure 4.
Distinct transcriptional profile of Lrp5 and -6 dKO HSCs. A) RNA-Seq was performed on WT and dKO mice HSCs (CD34−Flt3− LSK cells) isolated from BM. A volcano plot of log2(fold change) (dKO-WT) vs. nominal P value (−log10) is shown. Differentially expressed genes (>1.5 fold, P <0.05) are highlighted in light blue (down-regulated) and red (up-regulated) dots. B) Representative gene ontology biologic process categories enrichment map of differentially expressed genes (>1.5 fold, P <0.05). C) Kyoto Encyclopedia of Genes and Genomes (KEGG) analysis of differentially expressed genes in dKO HSCs compared to WT cells in normal physiologic system and disease. D) GSEA showing significant enrichment of the self-renewal gene signature, cell cycle, DNA repair, DNA replication, and hematopoietic signature [False discovery Rate (FDR) < 0.25]. Note that a reported P = 0 indicates an actual P < 1 per number of permutations. In our analysis, the number of permutations was set at 1000, and thus the reported “P = 0” is equivalent to P < 0.001. E) Heat map showing the differentially expressed genes of hematopoiesis signaling pathways. F) Heat map showing the differentially expressed genes of cell cycle. G) qRT-PCR analysis of selected differentially expressed genes in RNA-seq. Relative gene expression levels were normalized to Gapdh. Data are from 1 experiment with biologic duplicates (A–F) or pooled with 2 experiments with duplicates from at least 5 mice per group (G); mean ± sd. *P < 0.05, **P < 0.01 by Student’s t test.

