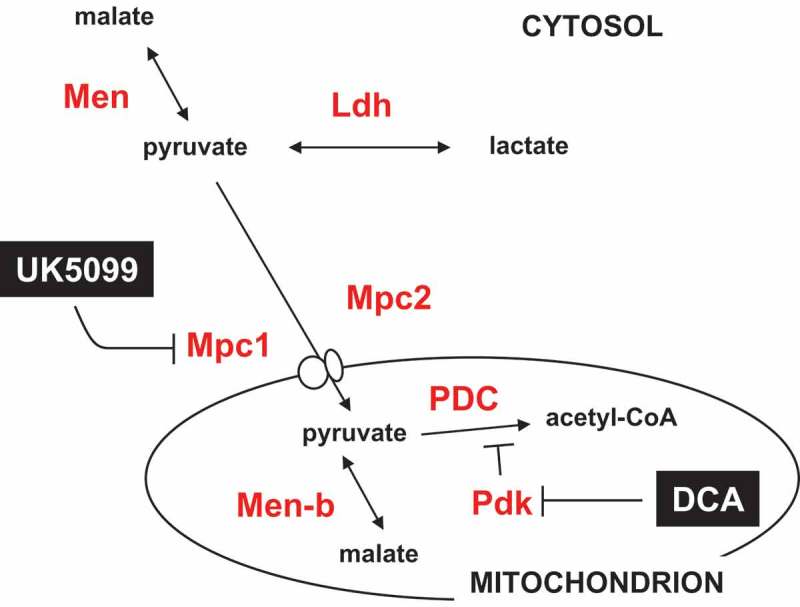
Figure 10.

Summary diagram of steps in the pyruvate metabolic network targeted by drugs and RNAi. Metabolites are shown in black text, proteins in red, and drugs in white on black. Mpc1, Mpc2, Pdk, Men, Men-b and Ldh are shown by the systematic names from flybase. PDC – pyruvate dehydrogenase complex. For clarity, enzymes not targeted in the present experiments (such as pyruvate kinase and pyruvate carboxylase) are omitted.
