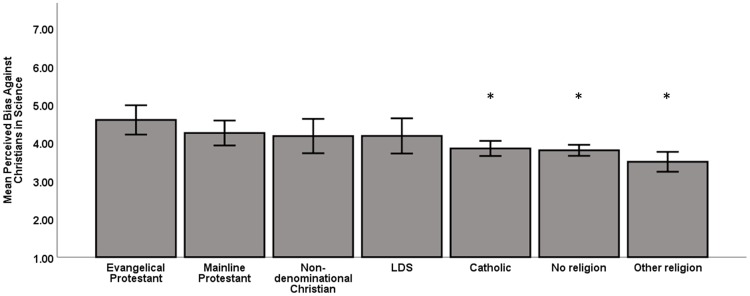
Fig 1. Students from every background perceive bias against Christians, but evangelicals perceive the most bias.
Scores ranged from 1–7 and were reverse coded so that higher scores represent higher perceptions of bias against Christians in science. Error bars represent the 95% confidence intervals. Asterisks are placed above groups that scored statistically different from evangelical Protestant students as determined by ANOVA and Games Howell post hoc tests (significance at p < .05).

